SC Visualization Module Overview
The SC Visualization Module provides a dynamic interface for high-dimensional datasets, offering a robust framework to explore scRNA, snRNA, and ST data. Its core features include the presentation of single-cell clustering information, multi-spatial tissue slices, smooth panning and zooming capabilities, and dual-screen display options. Interactive features enable users to freely explore these datasets, facilitating side-by-side comparisons and uncovering hidden characteristics. Additionally, the scMultiview, which enhances comparative analyses across multiple genes by providing common marker features visualization such as scatter plots, violin plots, and bubble plots. This broadens the scope for comprehensive insights into diverse factors, such as cell types and disease states.
1 Basic Functions of Single-Cell Module:
The SC panel supports dynamic visualization of cell clustering generated by different dimensionality reduction methods such as UMAP, tSNE, and PCA. Each point on the clustering map represents a cell, offering toggleable cell cluster annotations. Additionally, the SC panel's Dual Screen mode enables simultaneous viewing of cell cluster information and feature expression distributions.
1.1 Icon function summary
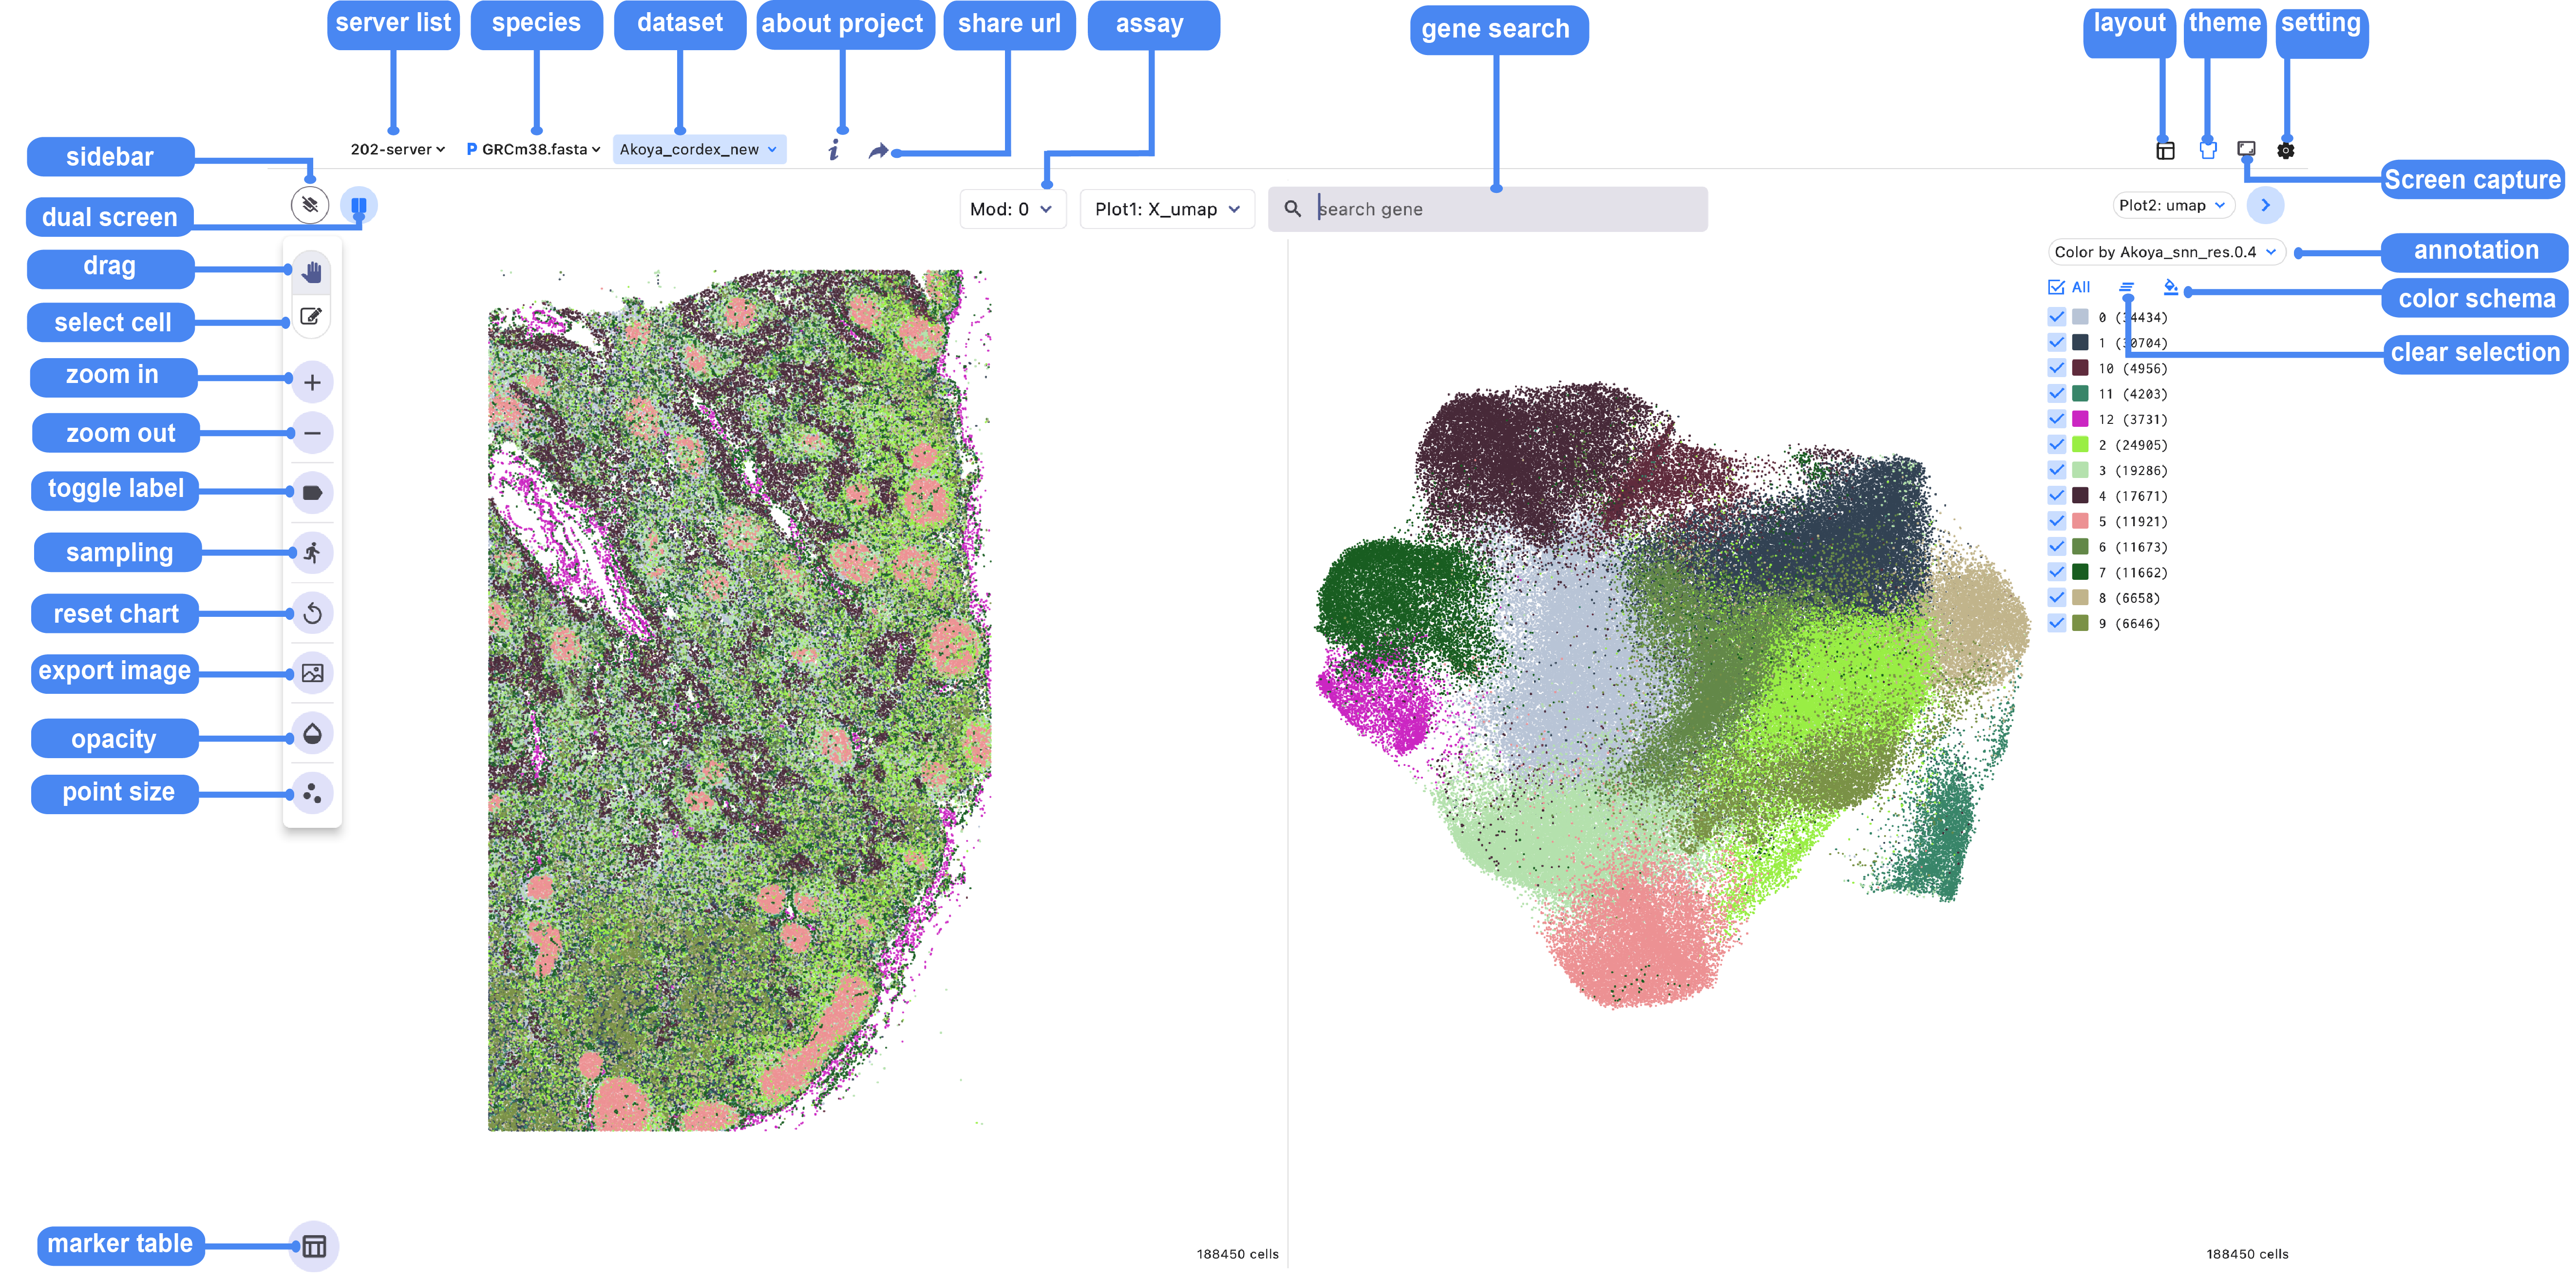
The toolbox is located in the sidebar and at the top of the single-cell browser window and contains tools to perform the list of functions in the following table:
| Icon | Function Description |
|---|---|
| Clean interface mode, collapses all sidebars and shortcut icons | |
| Quickly switch between single-screen mode and dual-screen mode | |
| Random downsampling algorithm to help fast data visualization | |
| Smoothly drag to view specific cell regions | |
| Used to box-select and export the desired cell regions | |
| Continuously zoom in on cell regions | |
| Continuously zoom out on cell regions | |
| Display annotation labels on cell clusters | |
| Quickly adapt the canvas to the current screen size | |
| Capture a quick screenshot of the canvas and save it | |
| Adjust the transparency of the background image | |
| Adjust the size and transparency of points in the cell scatter plot | |
| Open the marker table for display | |
| Open the sidebar for cell annotation label information | |
| Select all cell clusters | |
| Deselect the selected cell clusters | |
| Quickly customize colors for all cell clusters | |
| Display marker features table(gene, peak, sc-eQTL) |
Dynamic example:
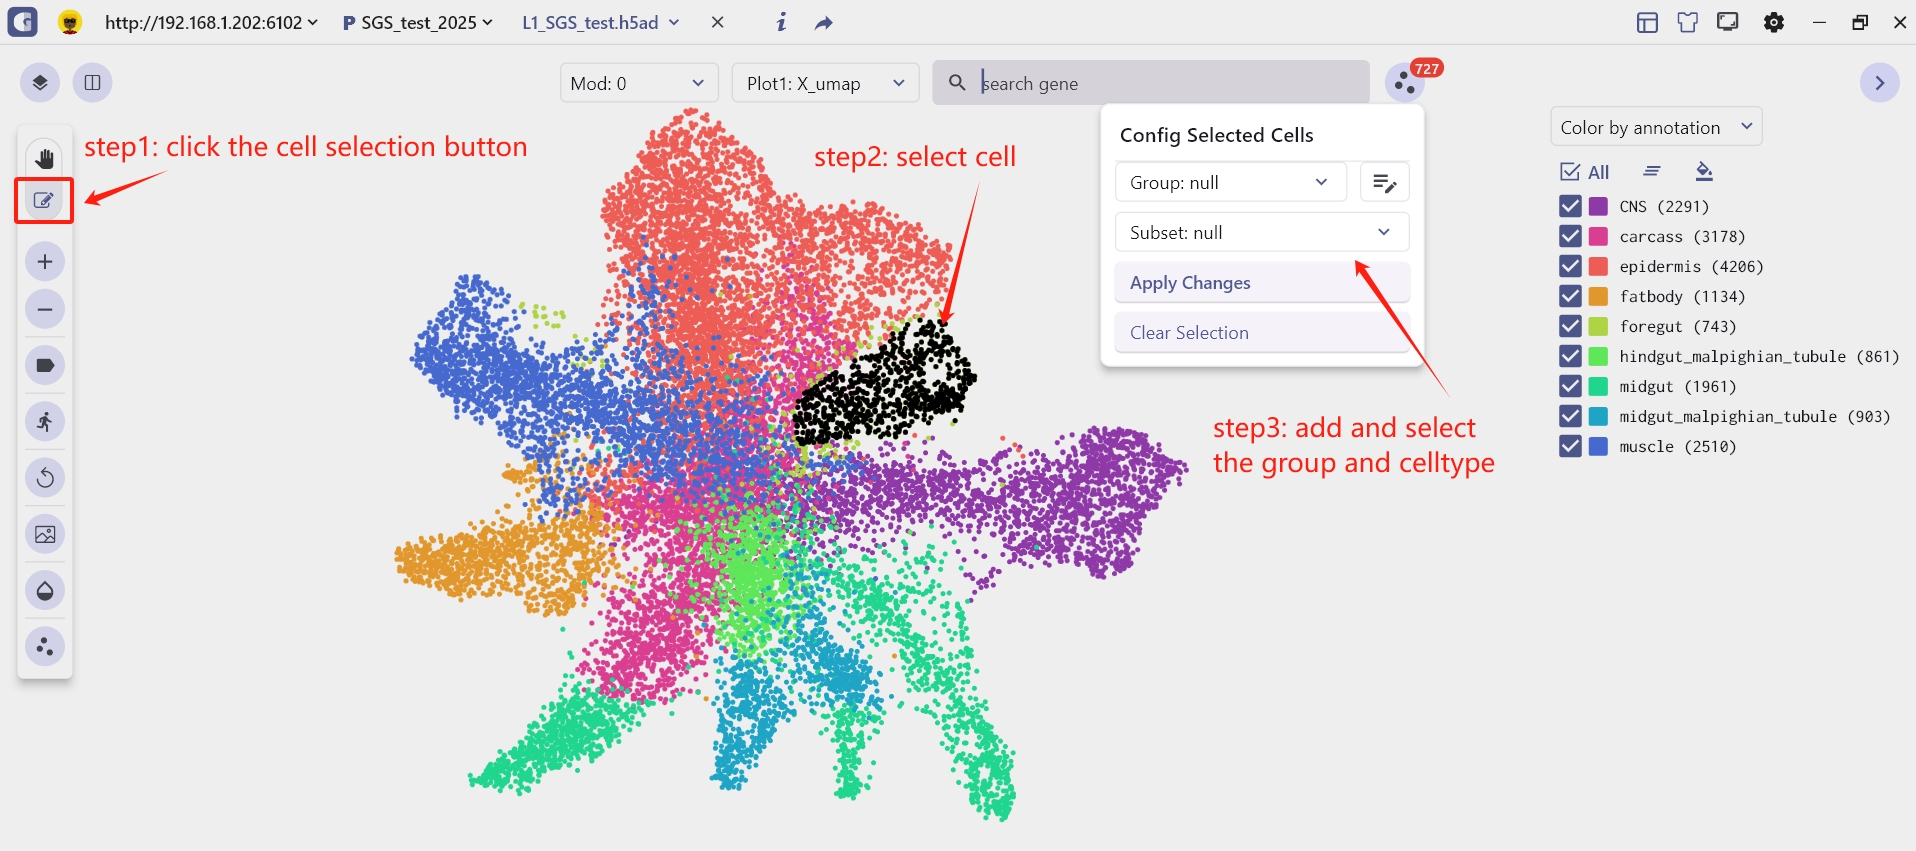
1.2 Cell Annotation
(1) Click the 'Cell Selection' button to create a group and cell subset. ----> (2) Select a cell group ----> (3) Click on the group bar to choose the corresponding group and cell name to complete the cell annotation.
Dynamic example: 
2.1 Spatial Transcription visualization interface Settings
The SC panel supports the visualization of spatial omics data for single or multiple samples, presenting images and 2D scatter plots to illustrate the spatial distribution of different cell clusters within tissues. Users can adjust the transparency of H&E images or spatial points to enhance the visualization of histological images. Thumbnails of H&E-stained images for each sample are displayed at the bottom of the SC panel, allowing users to select and explore any slice for investigation. Besides, SGS also provides right-click Settings to quickly adjust point size, display labels, switch spatial slices, fix plot, change image resolution, and view the data description.
2.2 3D Spatial Transcriptomics Data Visualization Interface Settings
In the 3D SRT data visualization mode, SGS enables users to interactively explore 3D meshes. Users can adjust the transparency of the mesh models, the size and transparency of points, animate the mesh models, and view the expression heterogeneity of genes in the 3D view. 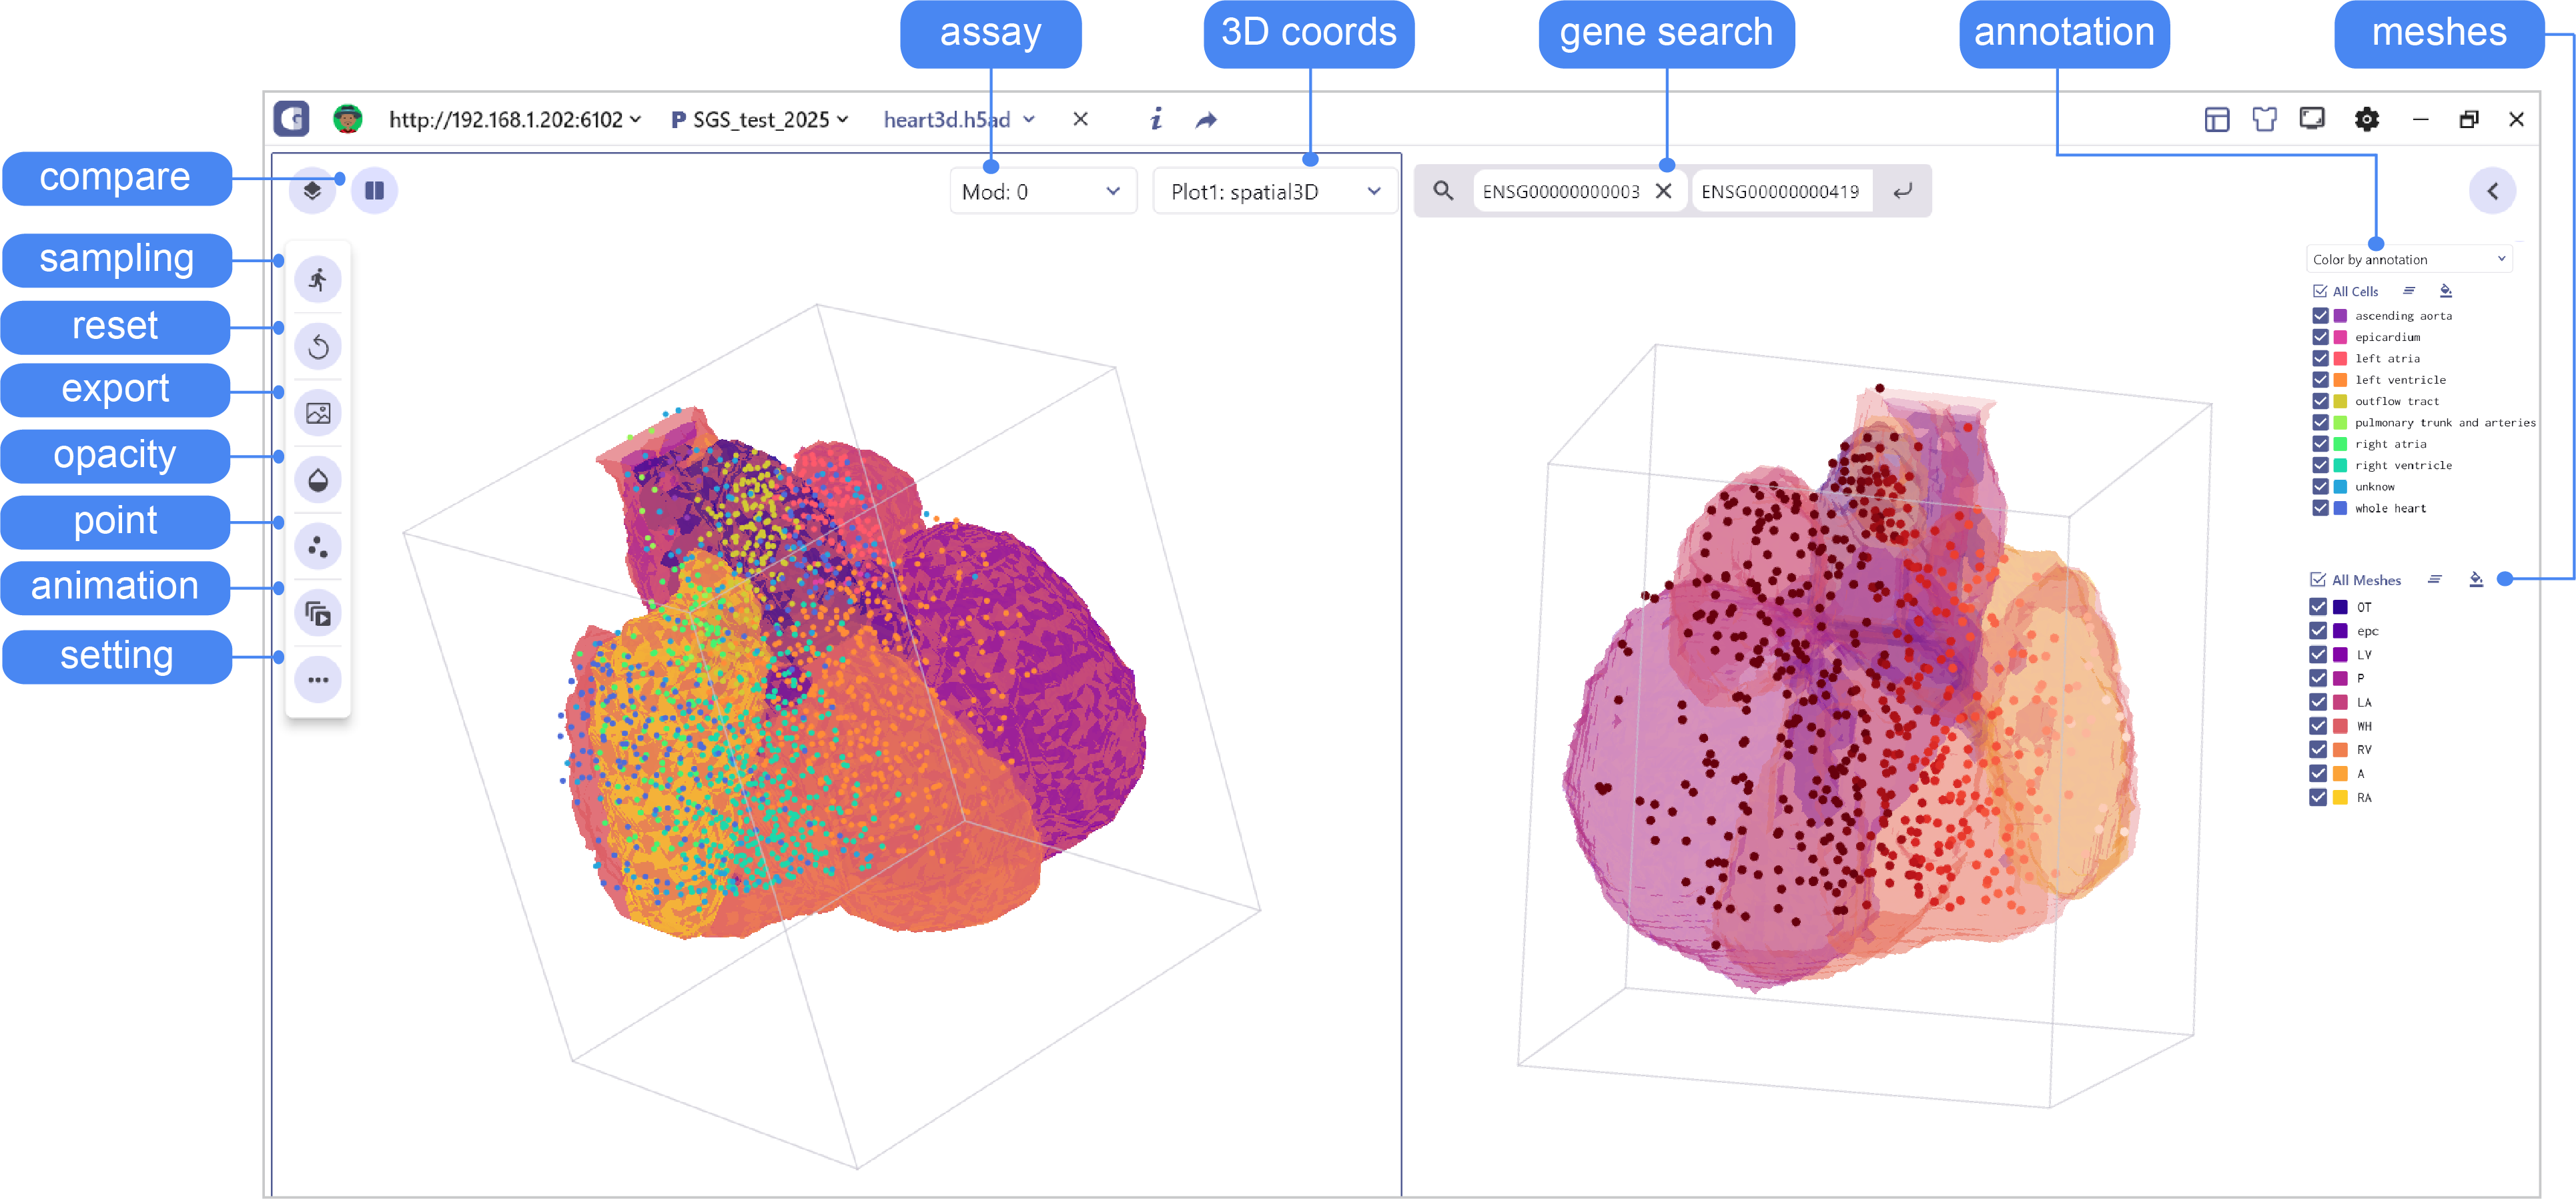
Dynamic example:
3 Metadata Feature Tables
The bottom of the main interface prominently displays essential information, including cell metadata, marker table, meta charts, Spatial slices, Feature Expression and cell selected. These features enable the examination of cell annotations, exploration of marker gene expression differences, comparison of cell compositions across tissues, and visualization of spatial multislice data.
3.1 Marker table
The marker table mainly shows the marker feature information stored in adata.uns["markers"], which mainly contains gene, P value, logfoldchange and other information. Users can click on the gene to see the expression, sorting and so on.
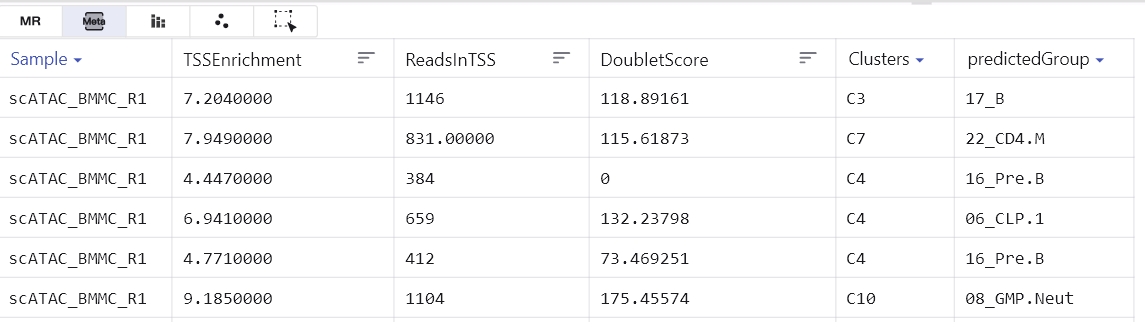
3.2 Metadata table
The meta table mainly shows the annotation information of the cell such as annotation, source, sample etc.
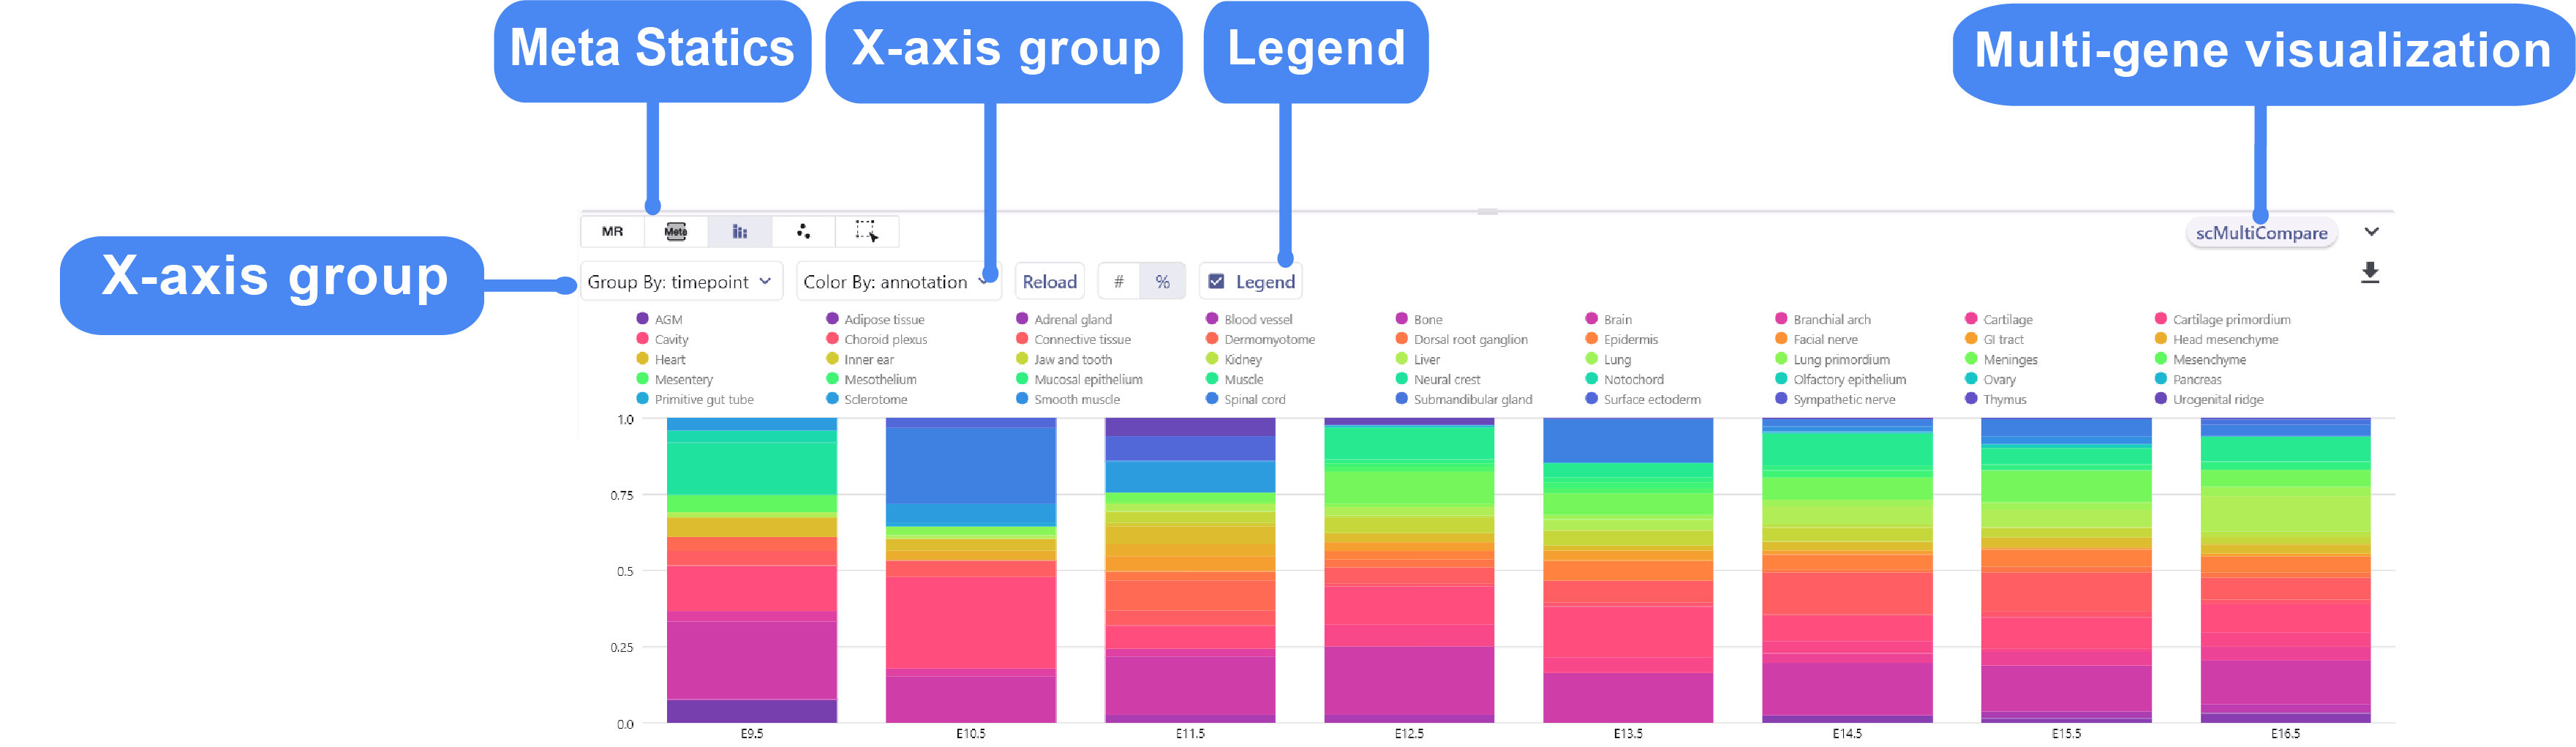
3.3 Meta Chart
The Meta-Chart quickly helps the user to understand the differences in cell proportion between different groups, and the user can change the color theme by clicking on the Reload Chart.
Dynamic example:
3.4 Spatial Slice
Spatial Slice mainly shows all the slice information in the spatial multi-sample data, and the user can click on the slice to change the sample information in the main panel of the visualization.
3.5 Feature Expression
Feature Expression mainly caches the expression scatterplot of the genes retrieved by the user in the search bar, and its cached information is updated in real time as the visualization subpanel is switched in dual-screen mode.
3.6 Cell selected
Cell selected mainly shows the subset of cells selected by the user with barcode id information, which can be exported to csv.
4 Marker Feature Search
Users can enter one or more genes in the SGS gene search box to see their expression levels.
5 Comparative Visualization
5.1 Spatial Multi Sample Visualization
The SC module also allows side-by-side comparisons of spatial slices, helping to compare gene expression patterns and tissue slice characteristics across multiple sample groups in ST experiments.
Dynamic example:
5.2 Comparison Visualization of single-cell epigenomics data
Users can enter the split screen mode, select the subpanel switch matrix, and input the feature of interest to compare and view different modes such as peak matrix, genescore matrix, motif matrix, etc.
5.3 Comparison Visualization of single-cell annotation information
The SC module supports split screen comparison, and users can click the "Switch view" button and select a specific screen to display cell type annotations and gene expression differences between groups.
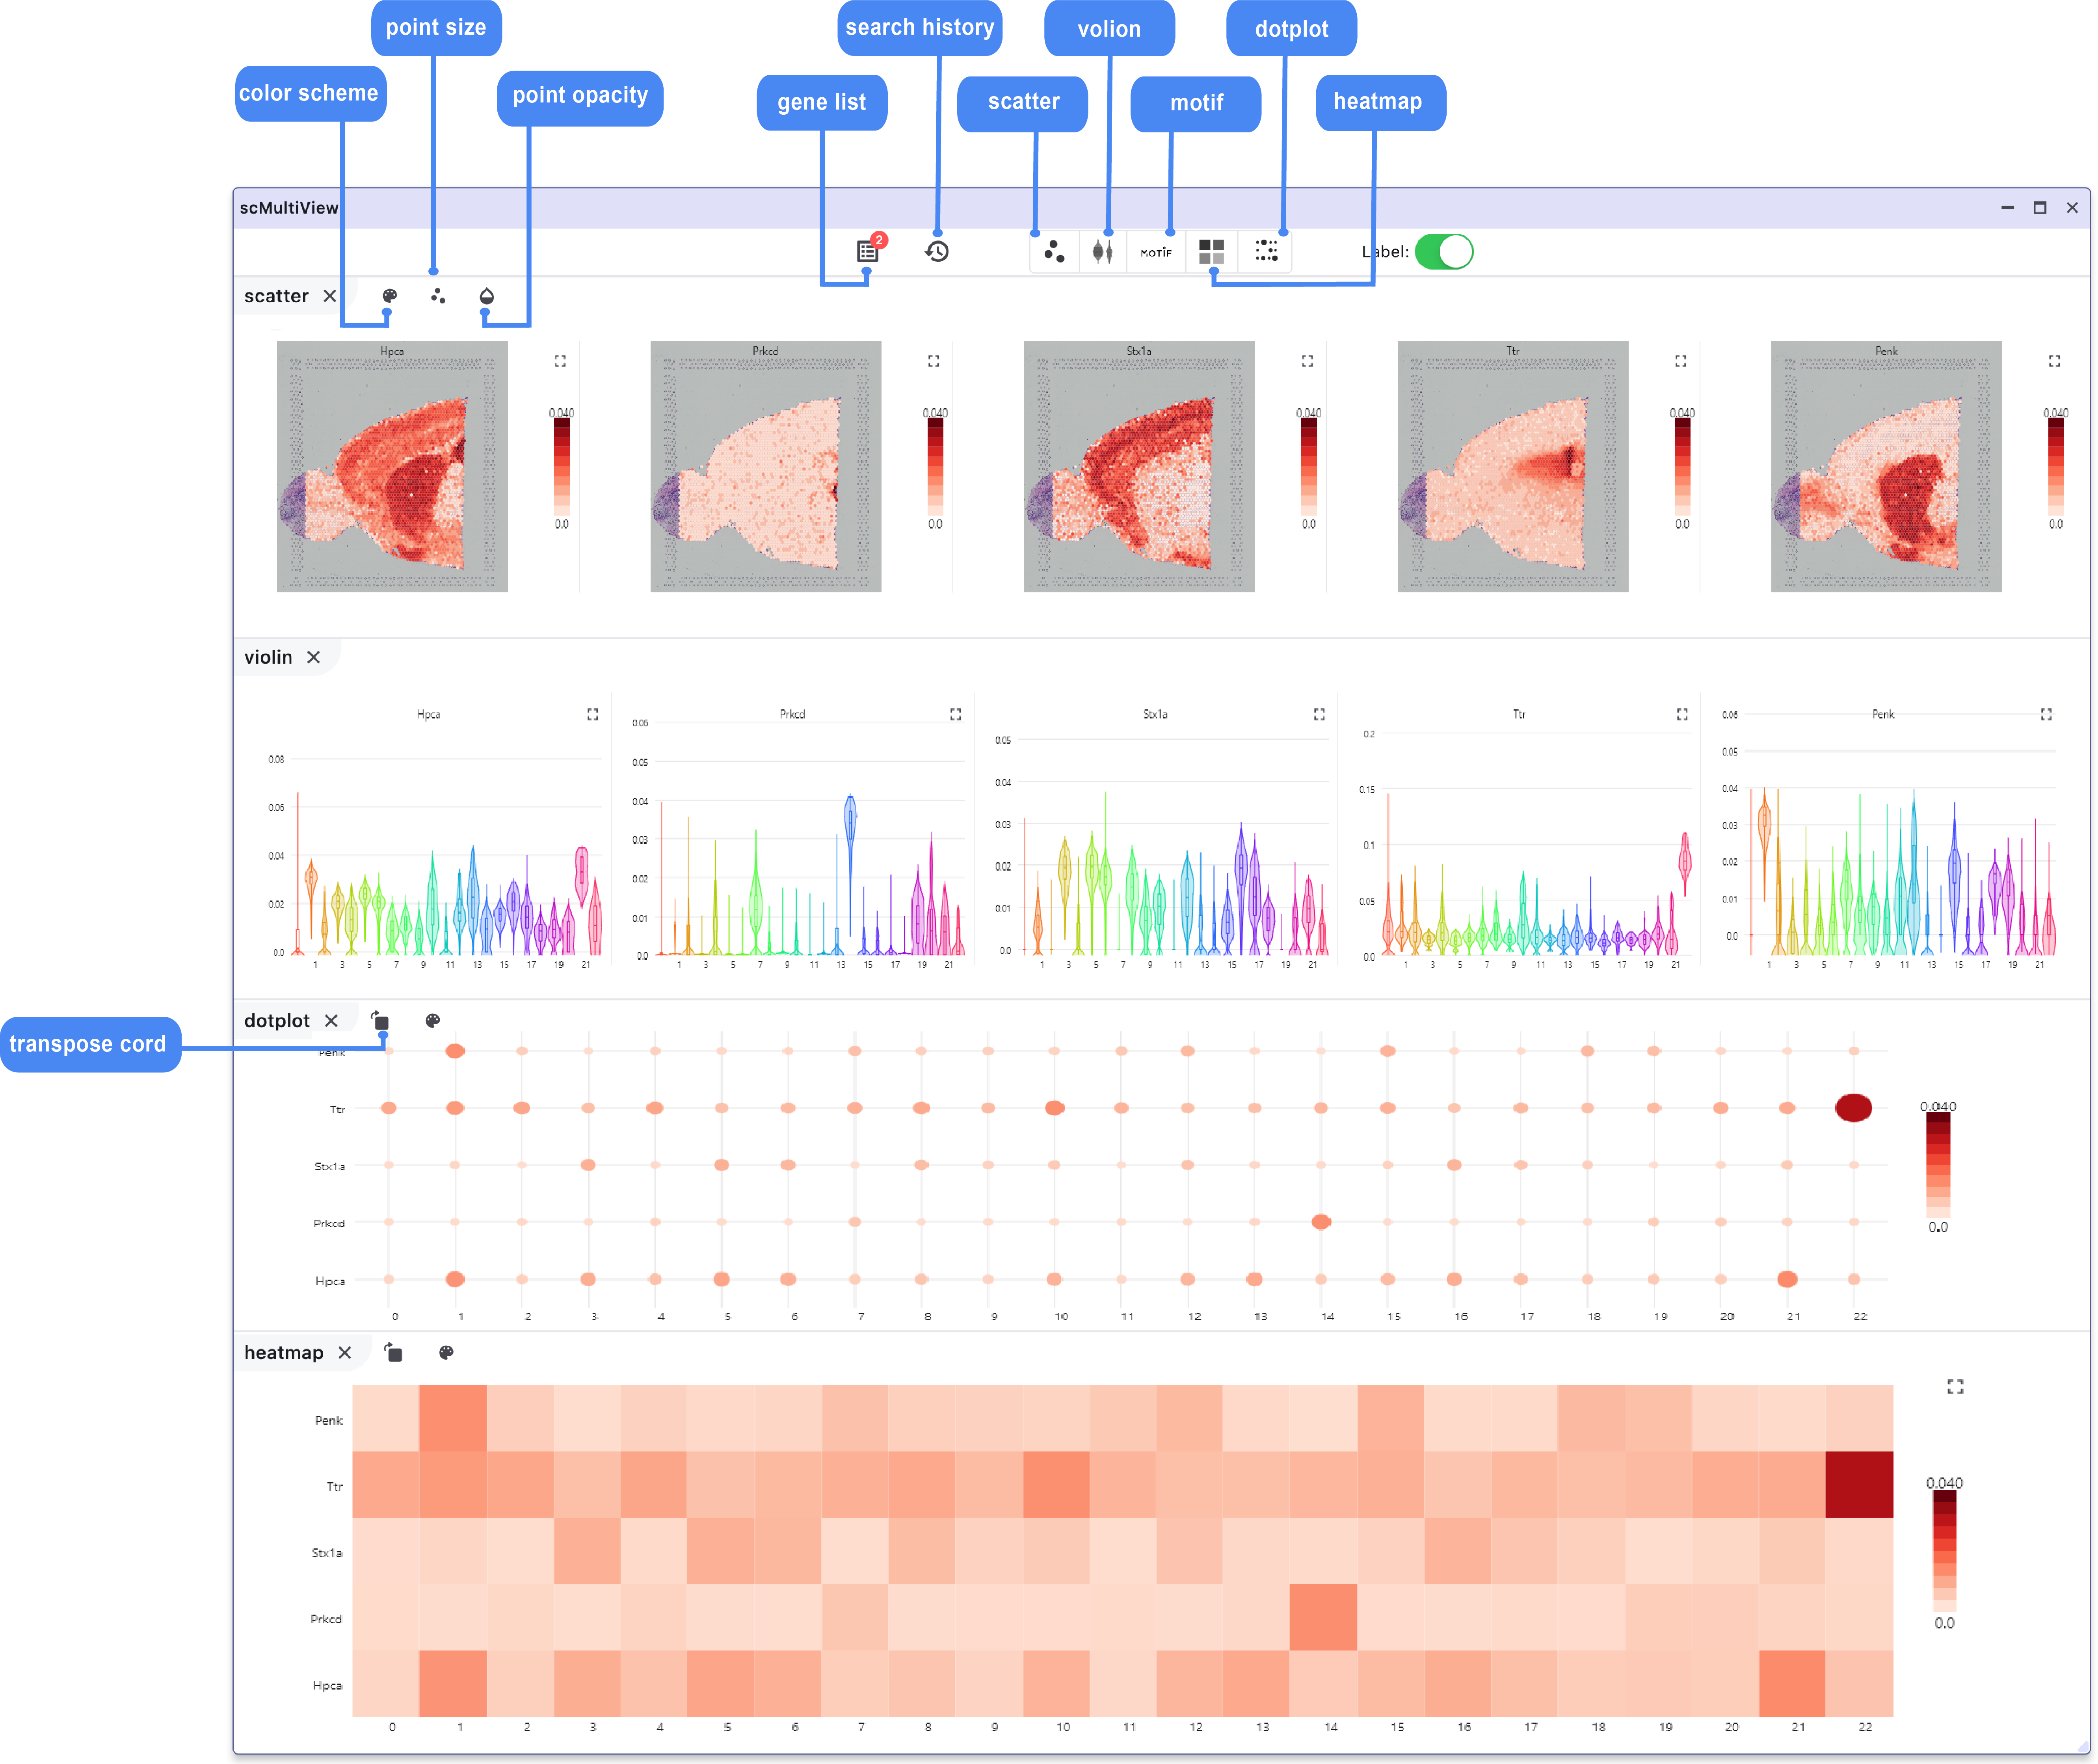
6 scMultiview Module:
The scMultiview module significantly enhances the plotting capabilities of the SC panel, facilitating comparative analysis across multiple genes. It supports the generation of various high-resolution visualizations, including:
Scatter plot illustrates the expression distribution of features across different cell clusters.
Spatial feature plot displays the expression distribution of features in different regions of spatial slices.
Violin plot primarily represent the statistical distribution of median expression values of marker genes in each cluster.
Motif logo plot reveals the motif motifs of transcription factor binding sites.
Heatmap and Dot Plot show the expression distribution of multiple marker genes in different cell clusters (cell group annotations and expression legend displayed at the top and side of the heatmap, respectively).
Dynamic example: