
View NGS data
GFF track
GFF file is a \t-delimited, 9-column plain text file. It mainly describes the interval information of various features on the genome, including chromosomes, genes, transcripts etc.
NC_000001.11    BestRefSeq    pseudogene    11874    14409    .    +    .    ID=gene0;Dbxref=GeneID:100287102,HGNC:HGNC:37102;Name=DDX11L1;description=DEAD/H-box helicase 11 like 1;gbkey=Gene;gene=DDX11L1;gene_biotype=transcribed_pseudogene;pseudo=true
NC_000001.11    BestRefSeq    transcript    11874    14409    .    +    .    ID=rna0;Parent=gene0;Dbxref=GeneID:100287102,Genbank:NR_046018.2,HGNC:HGNC:37102;Name=NR_046018.2;gbkey=misc_RNA;gene=DDX11L1;product=DEAD/H-box helicase 11 like 1;transcript_id=NR_046018.2
NC_000001.11    BestRefSeq    exon    11874    12227    .    +    .    ID=id1;Parent=rna0;Dbxref=GeneID:100287102,Genbank:NR_046018.2,HGNC:HGNC:37102;gbkey=misc_RNA;gene=DDX11L1;product=DEAD/H-box helicase 11 like 1;transcript_id=NR_046018.2
NC_000001.11    BestRefSeq    exon    12613    12721    .    +    .    ID=id2;Parent=rna0;Dbxref=GeneID:100287102,Genbank:NR_046018.2,HGNC:HGNC:37102;gbkey=misc_RNA;gene=DDX11L1;product=DEAD/H-box helicase 11 like 1;transcript_id=NR_046018.2
NC_000001.11    BestRefSeq    exon    13221    14409    .    +    .    ID=id3;Parent=rna0;Dbxref=GeneID:100287102,Genbank:NR_046018.2,HGNC:HGNC:37102;gbkey=misc_RNA;gene=DDX11L1;product=DEAD/H-box helicase 11 like 1;transcript_id=NR_046018.2
The following figure of SGS show genes and their corresponding transcripts structures in group. 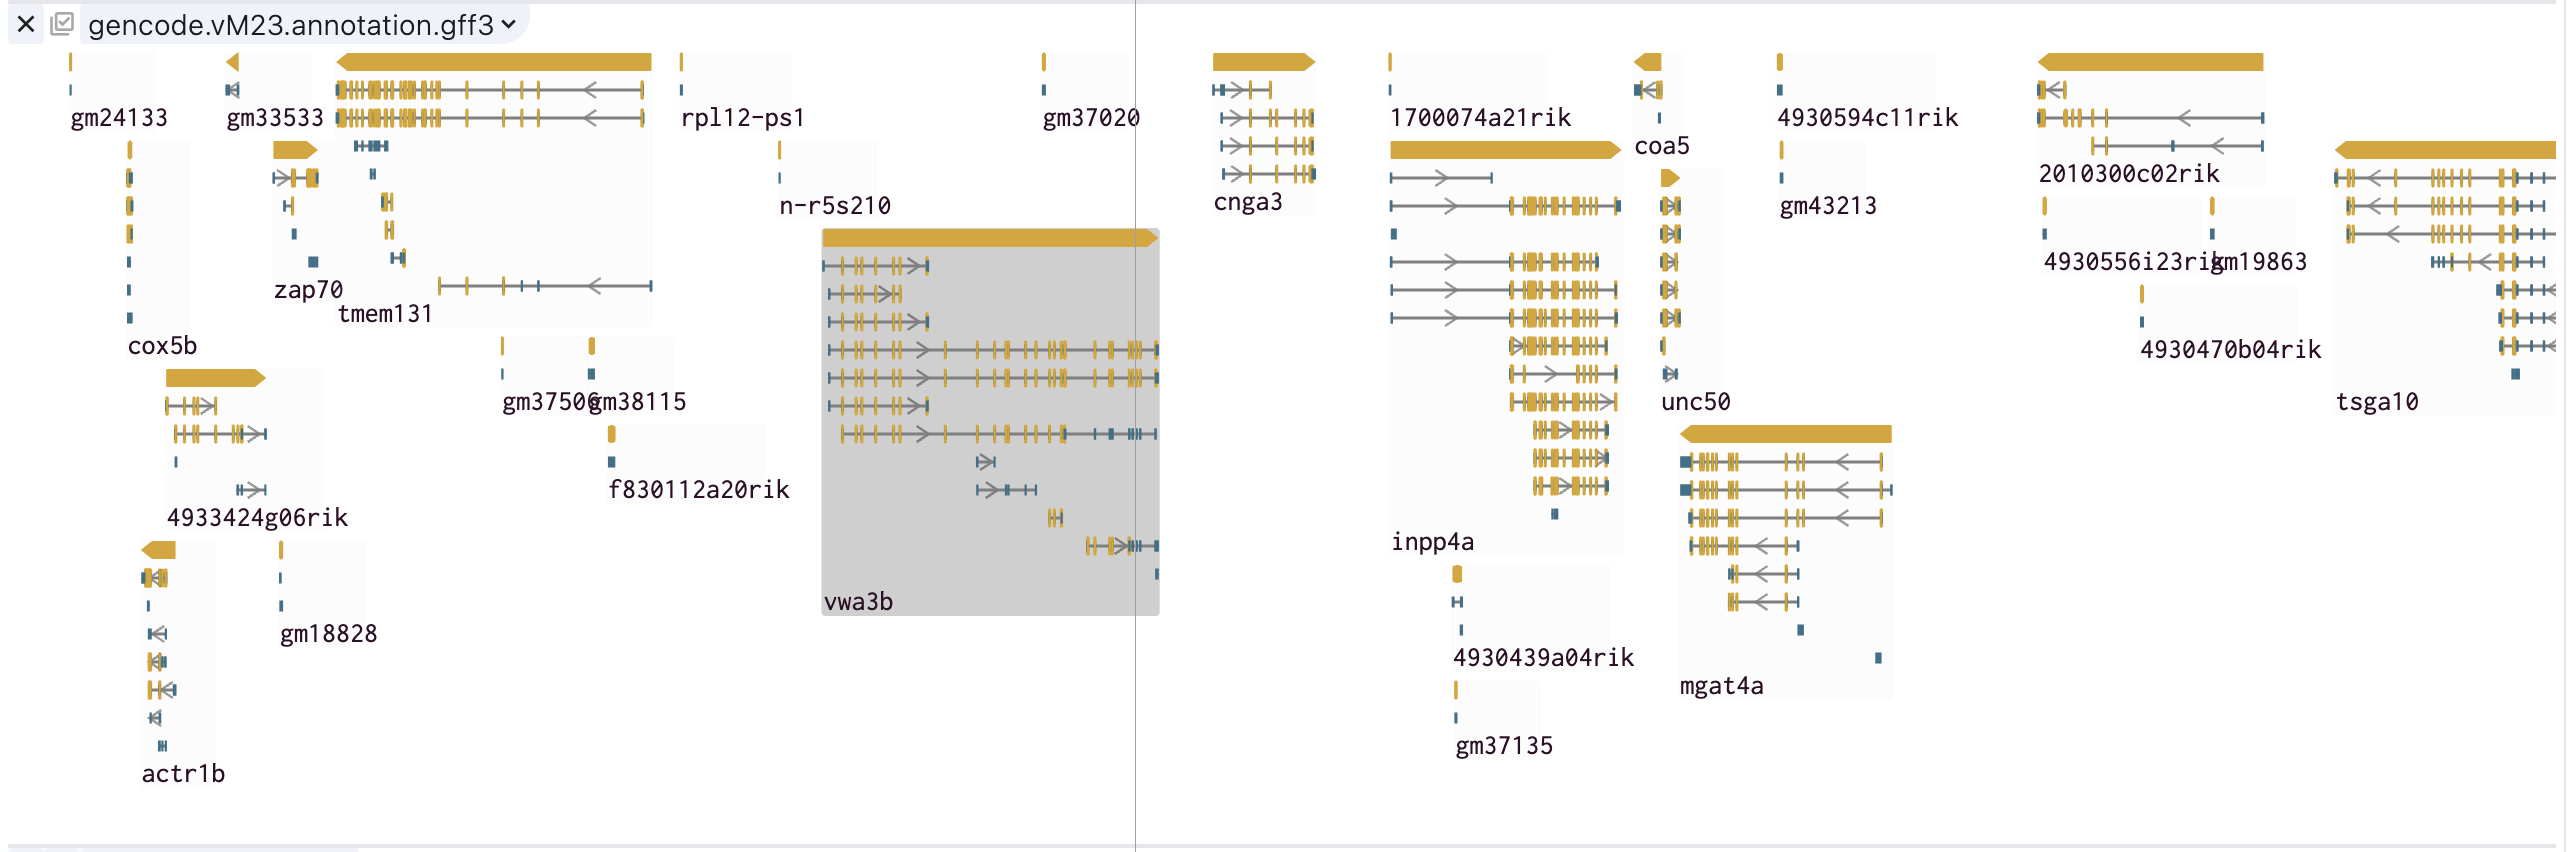
Users can adjust the style of GFF feature in track theme to view their interesting structures such as CDS, EXON, UTR. 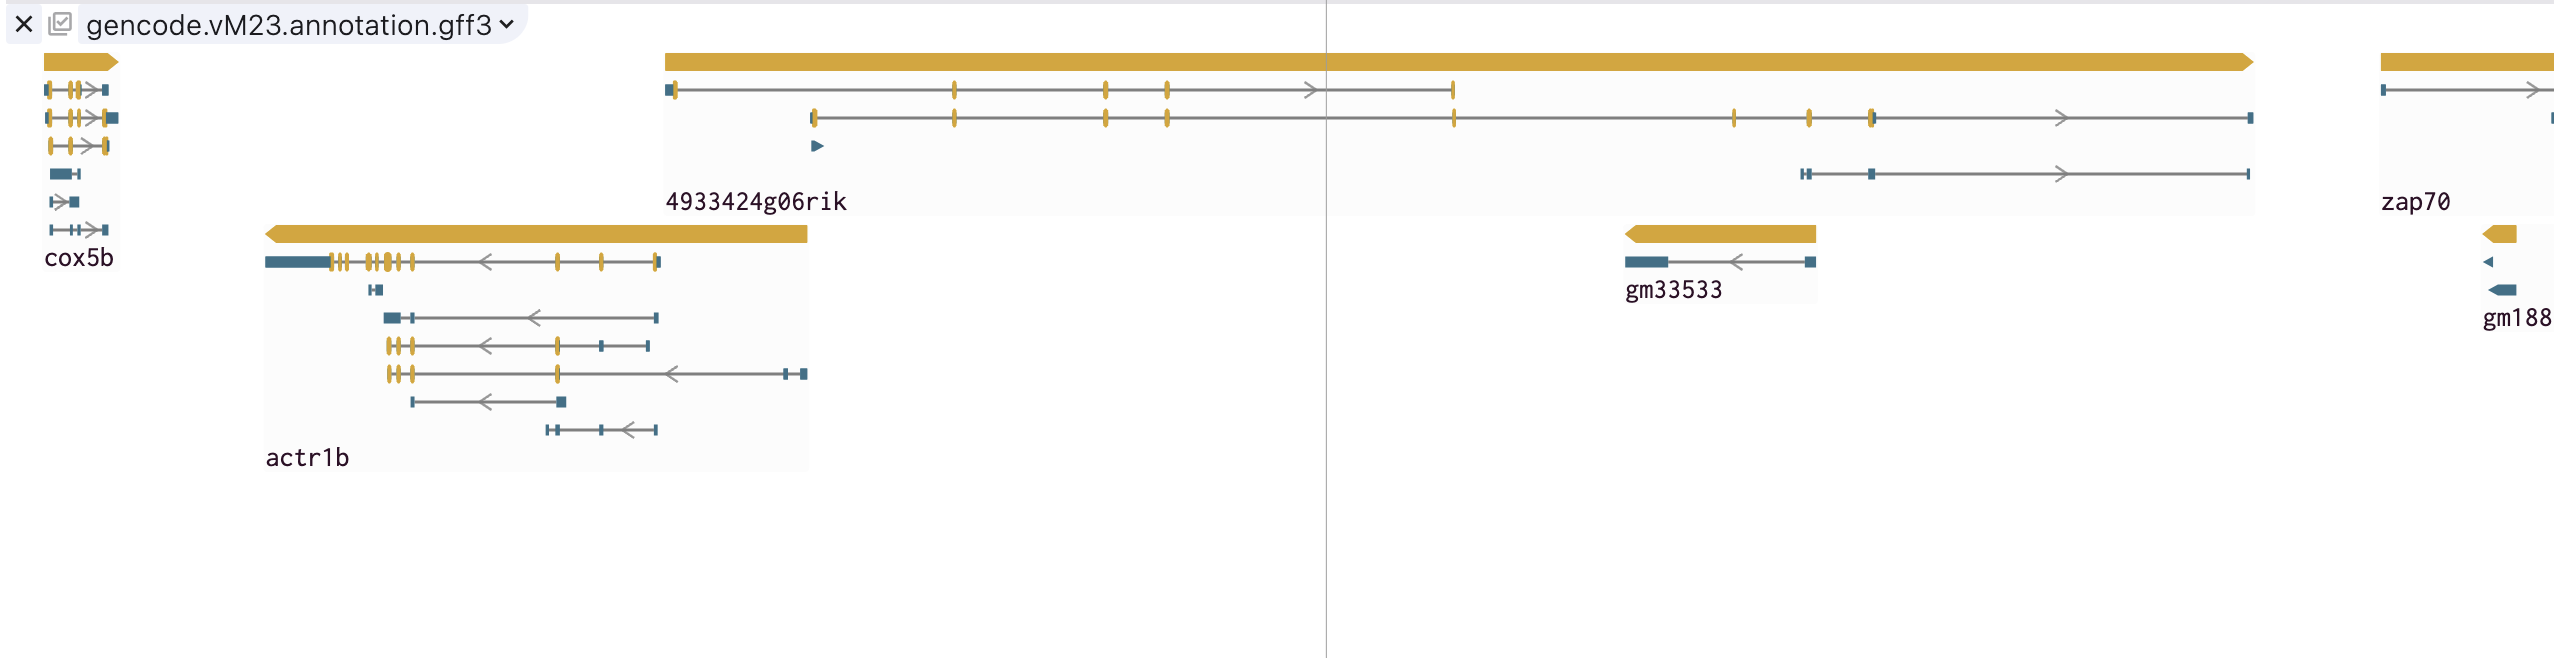
VCF track
VCF is the abbreviation of Variant Call Format(UCSC vcf format), which is a text file specially used to store gene sequence mutation information, including single base mutation SNV, single nucleotide polymorphism SNP, InDel, copy number variation CNV and structure Variant SV, etc. The beginning of the VCF file is the overall comment information, starting with ##, each line of the vcf body is a record, the fixed column has 9 columns, and the tenth column after that, they are:
| Column | Information |
|---|---|
| First column | CHROM: chromosome number; |
| Second column | POS: position on chromosome; |
| Third column | ID: mutation name; |
| Fourth column | REF: reference genome base type; |
| Fifth column | ALT: variant base type; |
| Sixth column | QUAL: the quality value of variant detection, the higher the more reliable |
| Seventh column | FILTER: the column that marks the filtering result; the one that passes the quality control filtering standard is marked as 'PASS'; |
| Eighth column | INFO: additional information column; |
| Ninth column | FORMAT: the description column of the following information; |
| Tenth column | sample information: GT=genotype, AD=number of bases supported, DP=sum of sequencing depth, PL=probability of genotype after normalization, GQ=quality value of genotype called by PL; |
##fileformat=VCFv4.0
##fileDate=20090805
##source=myImputationProgramV3.1
##reference=1000GenomesPilot-NCBI36
##phasing=partial
##INFO=<ID=NS,Number=1,Type=Integer,Description="Number of Samples With Data">
##INFO=<ID=DP,Number=1,Type=Integer,Description="Total Depth">
##INFO=<ID=H2,Number=0,Type=Flag,Description="HapMap2 membership">
##FILTER=<ID=q10,Description="Quality below 10">
##FORMAT=<ID=GT,Number=1,Type=String,Description="Genotype">
##FORMAT=<ID=HQ,Number=2,Type=Integer,Description="Haplotype Quality">
#CHROM POS     ID        REF ALT    QUAL FILTER INFO                              FORMAT      NA00001        NA00002        NA00003
20     14370   rs6054257 G      A       29   PASS   NS=3;DP=14;AF=0.5;DB;H2           GT:GQ:DP:HQ 0|0:48:1:51,51 1|0:48:8:51,51 1/1:43:5:.,.
20     17330   .         T      A       3    q10    NS=3;DP=11;AF=0.017               GT:GQ:DP:HQ 0|0:49:3:58,50 0|1:3:5:65,3   0/0:41:3
20     1110696 rs6040355 A      G,T     67   PASS   NS=2;DP=10;AF=0.333,0.667;AA=T;DB GT:GQ:DP:HQ 1|2:21:6:23,27 2|1:2:0:18,2   2/2:35:4
20     1230237 .         T      .       47   PASS   NS=3;DP=13;AA=T                   GT:GQ:DP:HQ 0|0:54:7:56,60 0|0:48:4:51,51 0/0:61:2
20     1234567 microsat1 GTCT   G,GTACT 50   PASS   NS=3;DP=9;AA=G                    GT:GQ:DP    0/1:35:4       0/2:17:2       1/1:40:3
The VCF display in SGS includes the following information: It presents the variation position and type for each variant site, as well as the variation information for each sample. This includes statistical classification of sample variation information, genotype information (homozygous, heterozygous, non-variant), and specific details such as variant number and variant score.
BigWig Track
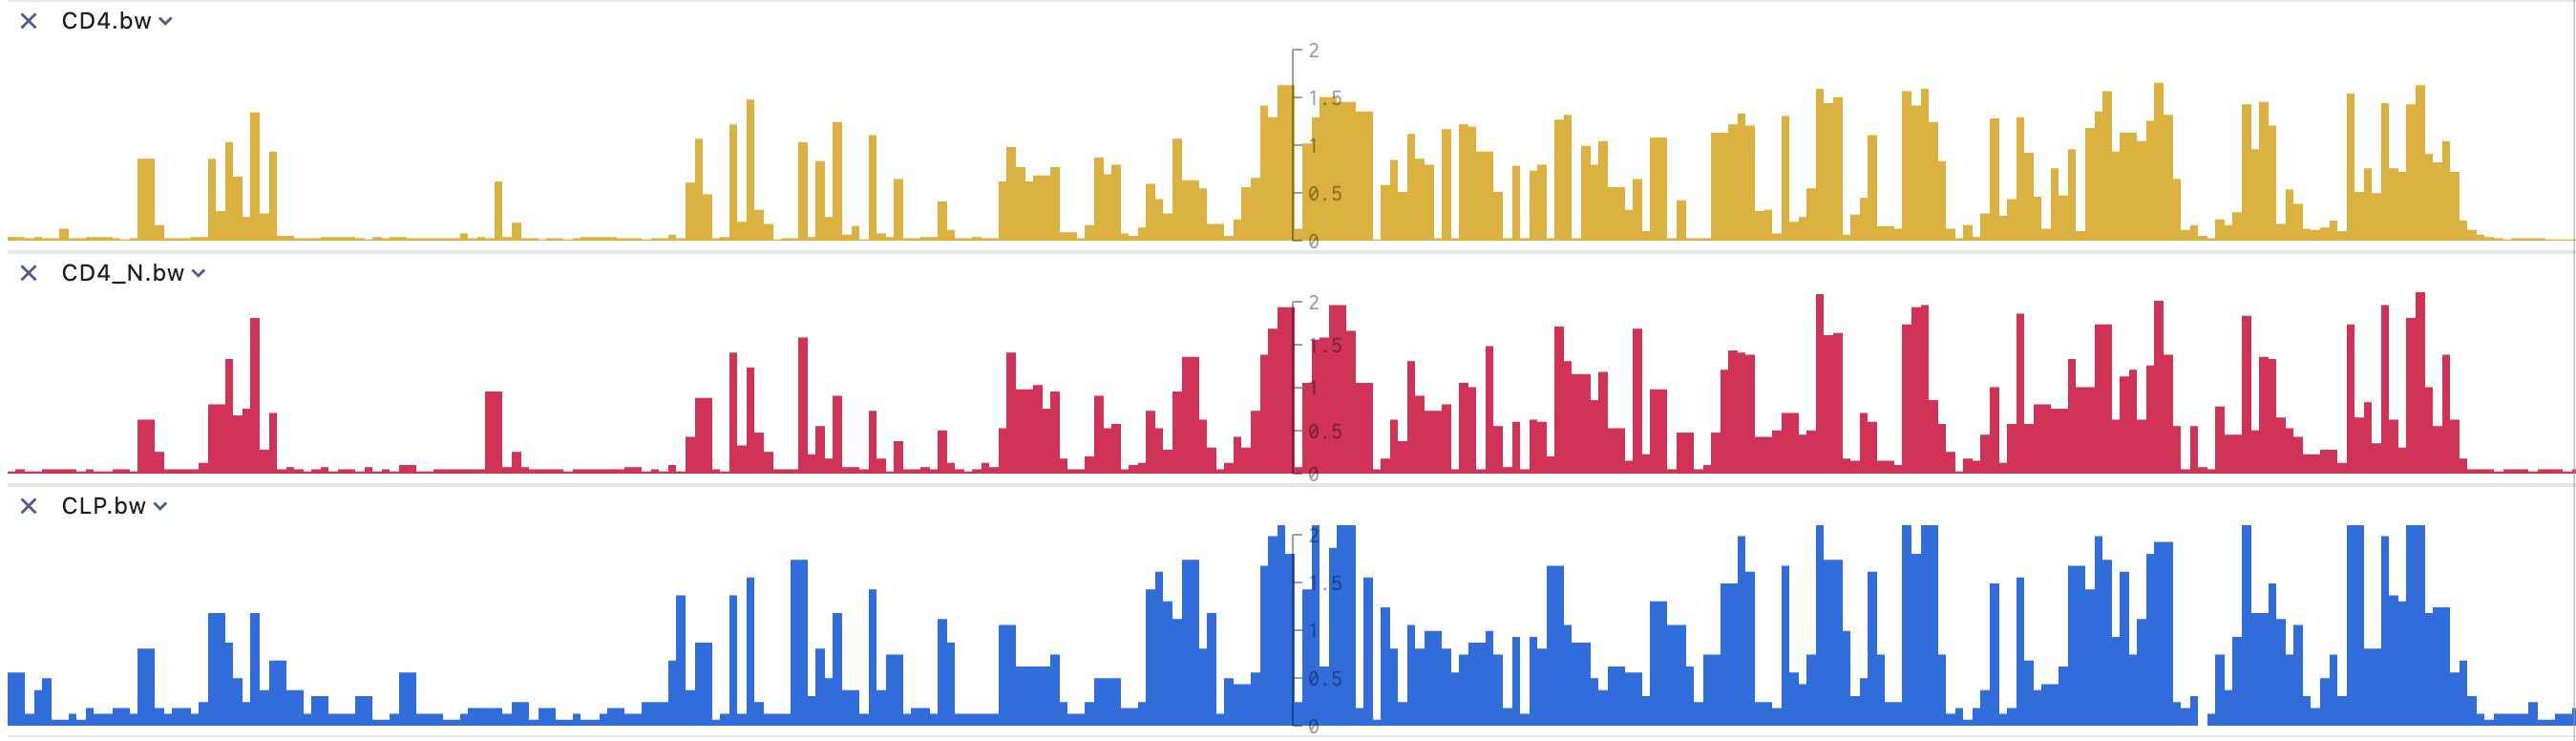
BigWig files are created from wiggle (wig) type files using the wigToBigWig program. BigWig files are indexed binary formats(UCSC bigwig format). The display performance of BigWig files is much faster than regular wiggle files when dealing with large datasets. Note: Wiggle data must be contiguous and consist of elements of equal size. If your data is sparse or contains elements of different sizes, use bedGraph format instead of wiggle format. If you have a very large bedGraph dataset, you can convert it to BigWig format using the bedGraphToBigWig program.
SGS displays dense, continuous data as graphs, with peaks representing scores at different locations. It offers various statistical modes such as max, min, mean, and sum, along with normalization methods like Linear, Pow.5, Log.
Bedgraph Track
Bedgraph is a \t-delimited, 4-column plain text file. It mainly used to records continuous data such as transcriptome or chip analysis data. The first column is , second column is , third column is and the last column is third column is .
chr19   49302000    49302300    -1.0
chr19   49302300    49302600    -0.75
chr19   49302600    49302900    -0.50
chr19   49302900    49303200    -0.25
chr19   49303200    49303500    0.0
chr19   49303500    49303800    0.25
chr19   49303800    49304100    0.50
chr19   49304100    49304400    0.75
chr19   49304400    49304700    1.00

Bed Track
A track for all bed-like files (with first column chromosome, second start and third end). If the other columns fit the requirement as defined in UCSC additional fields can be used. For example, the 5th and 9th column can be used to change the color of intervals, the 6th column indicate the strand. By default, intervals without strand are displayed as rectangle and for intervals with strand an arrow is added at the extremity (not included in the interval). In case of BED12 format, the introns are displayed into another color. But other styles are available.
chr7    127471196  127472363  Pos1  0  +  127471196  127472363  255,0,0
chr7    127472363  127473530  Pos2  0  +  127472363  127473530  255,0,0
chr7    127473530  127474697  Pos3  0  +  127473530  127474697  255,0,0
chr7    127474697  127475864  Pos4  0  +  127474697  127475864  255,0,0
chr7    127475864  127477031  Neg1  0  -  127475864  127477031  0,0,255
chr7    127477031  127478198  Neg2  0  -  127477031  127478198  0,0,255
chr7    127478198  127479365  Neg3  0  -  127478198  127479365  0,0,255
chr7    127479365  127480532  Pos5  0  +  127479365  127480532  255,0,0
chr7    127480532  127481699  Neg4  0  -  127480532  127481699  0,0,255
At a larger zoom level, the SGS genome browser provides a variety of modes to display the statistical distribution of the number of bed fearures. 
At a smaller zoom level, it mainly displays the bed feature structure. 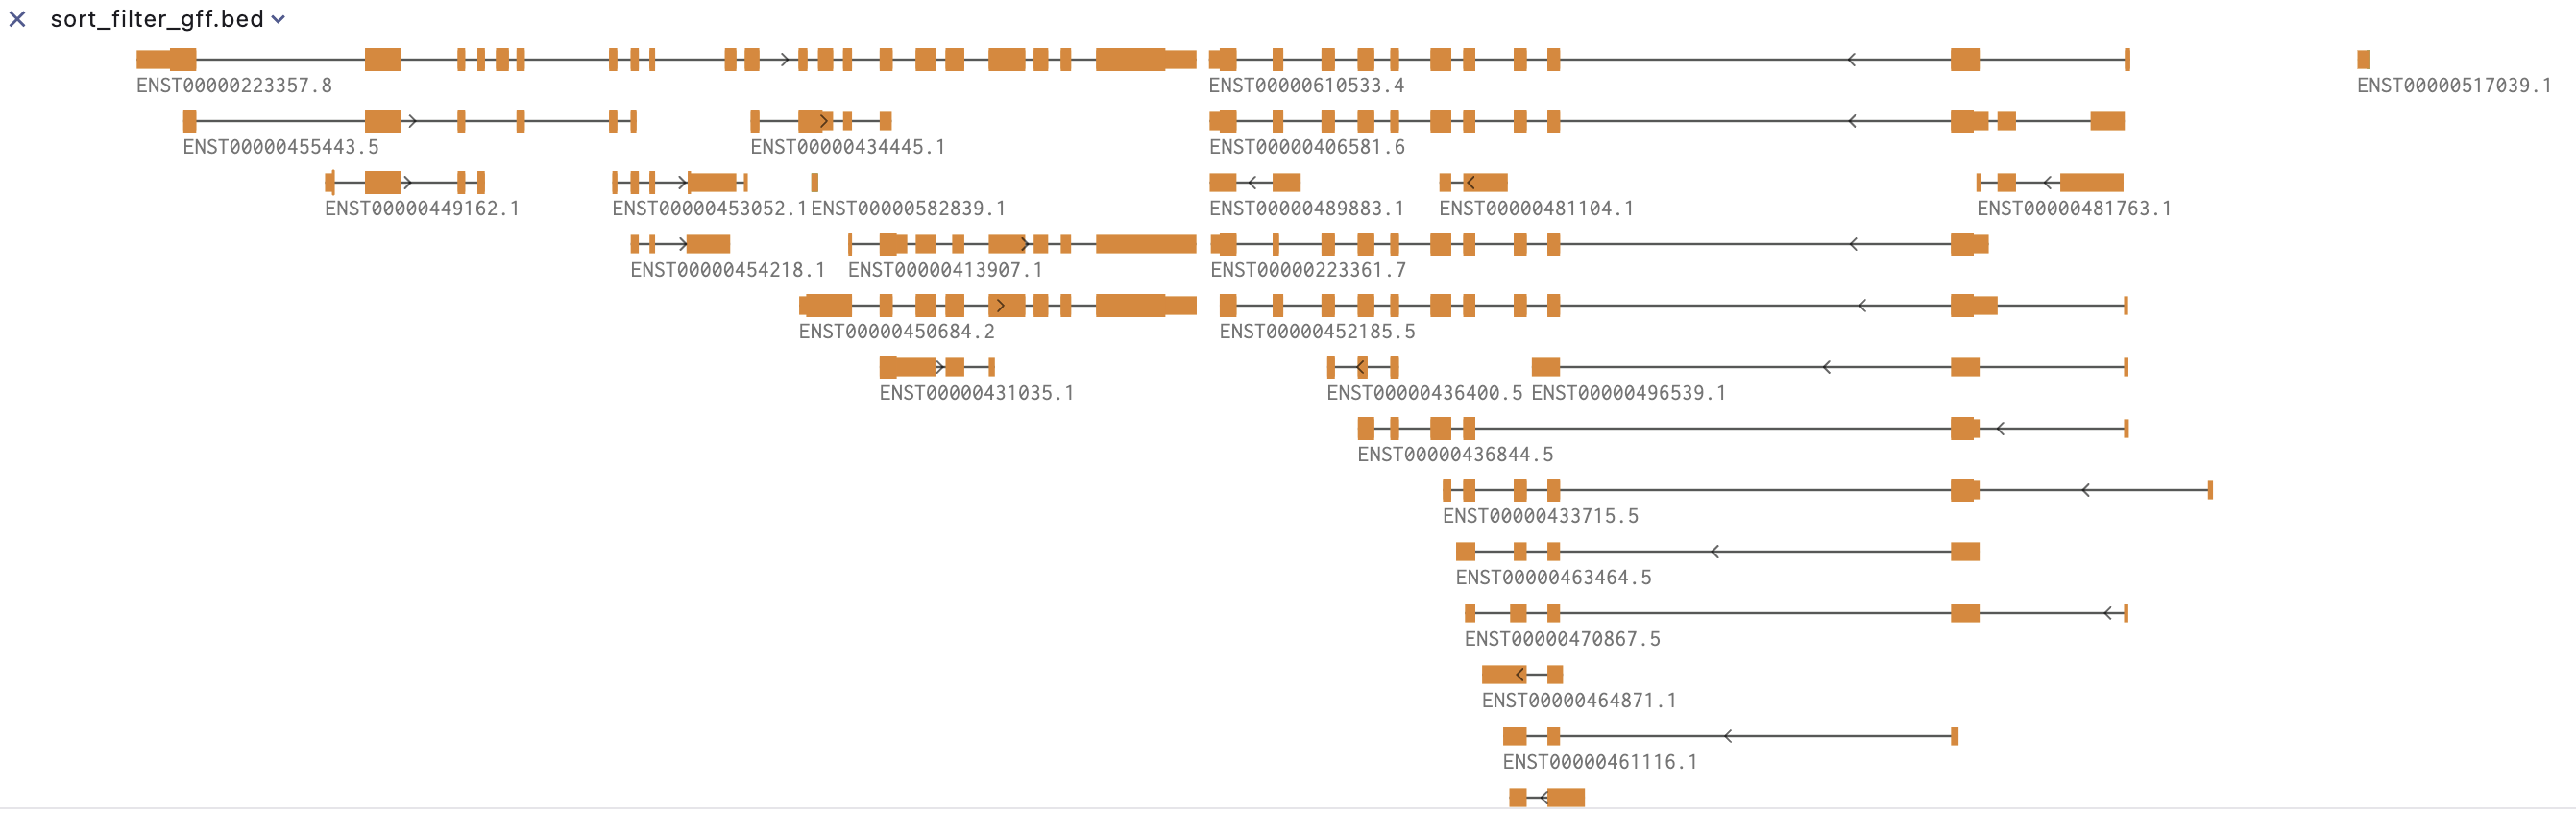
MethylC Track
The methylC file is a 7-column bed file that mainly records methylation at different genomic sites. From left to right, they are:, (0-based), (not included), (CG, CHH, CHG etc.), , , and .
chr1    10542   10543   CG      0.923   -       26
chr1    10556   10557   CHH     0.040   -       25
chr1    10562   10563   CG      0.941   +       17
chr1    10563   10564   CG      0.958   -       24
chr1    10564   10565   CHG     0.056   +       18
chr1    10566   10567   CHG     0.045   -       22
chr1    10570   10571   CG      0.870   +       23
chr1    10571   10572   CG      0.913   -       23
In order to better compare different methylation types, SGS displays CHG, CHH, CG and read depth information on the same track, and the specific methylation status of a genomic site can be viewed through mouse hover. In addition, the SGS genome browser also provides a split chart function to display the distribution of different methylation types separately.
Chromatin interaction Track
Hic
SGS mainly supports the visualization of .hic files, which mainly record the interaction information of different genome intervals. For specific hic data format, please refer to:hic format.
We provide two modes of heatmap and Arc to display the hic folder. Users can zoom to different levels to view the interaction at different resolutions, and the intensity of the interaction is displayed through the color depth. Users can view the two through the mouse hover. The interaction value of the interaction interval.
Longrange and biginteract
The longrange track is a bed format-like file type. It mainly consists of 4-6 columns, of which the first 4 columns are required and the last two columns are optional. From left to right are , (0-based), (not included), , (optional) and (optional). The target field mainly contains information such as the position of the target interaction interval and the interaction value. As an example, interval interacts with interval on a score of 2.
chr1    840086	840670	chr1:873317-874094,2	7837	+
chr1	856372	857075	chr1:873472-874198,2	7839	+
chr1	873317	874094	chr1:840086-840670,2	7838	-
chr1	873472	874198	chr1:856372-857075,2	7840	-
chr1	950622	951436	chr1:998665-999659,3	7841	+
chr1	974252	975234	chr11:518876-519376,2	71      .
chr1	974252	975234	chr11:518876-519376,2	69	.
chr1	998665	999659	chr1:950622-951436,3	7842	-
chr1	1056750	1057253	chr1:1165823-1166794,2	7843	+
chr1	1056981	1057755	chr1:1185448-1186693,3	7845	+
Biginteract
The interact format is available as a standalone plain text bed5+13 format. Biginteract is a binary indexed interact format. This format is useful for displaying functional element interactions such as SNP/gene interactions, and is also suitable for low-density chromatin interactions, such as ChIA-PET. For more details about this format, please check the UCSC biginteract format page.
SGS genome browser provides Arc mode, double mode and circle mode to display long-distance interaction.
Arc mode
Arc mainly shows the interaction of the same chromosome through arcs. 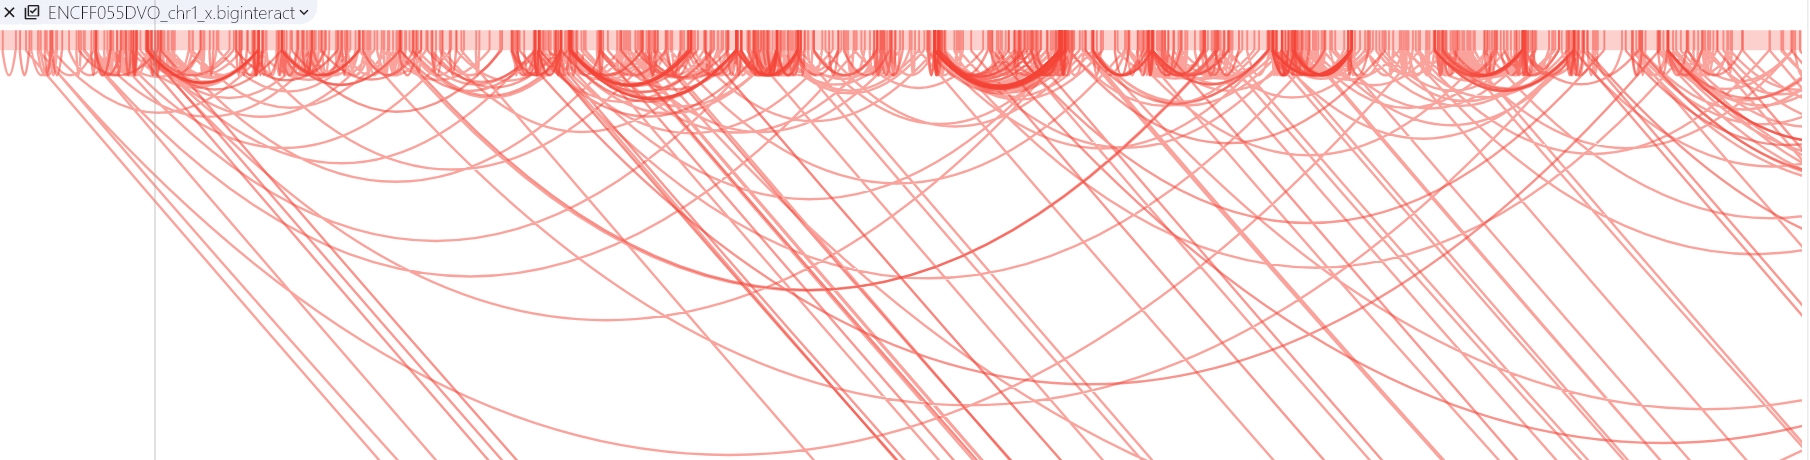
Double mode
The double-layer mode is mainly viewed in the compare mode, which forms an interaction block through the interaction interval between the upper and lower chromosomes. The strength of the interaction through the intensity of the color. Users can zoom in/out the region by hovering the mouse wheel on a chromosome or switch the interaction range by drag left/right. 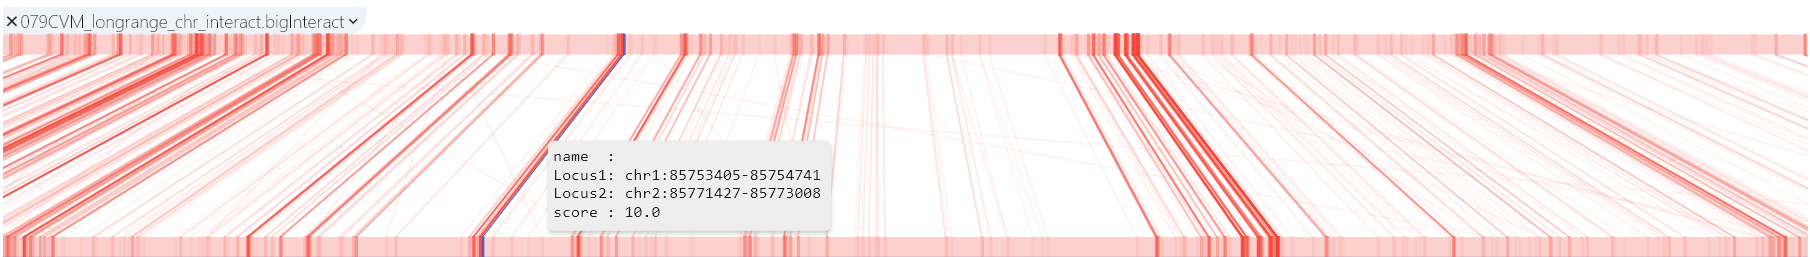
GWAS
A GWAS file is a space- or tab-delimited result file from genome-wide association study (GWAS) analysis. These files include PLINK result files containing integrated map information (i.e., chromosomal location for each association). File extensions for GWAS files are: .linear, .logistic, .assoc, .qassoc, .gwas GWAS file must contain a header line and four required columns (case-insensitive):
- CHR: chromosome (aliases chr, chromosome)
- BP: nucleotide location (aliases bp, pos, position)
- SNP: SNP identifier (aliases snp, rs, rsid, rsnum, id, marker, markername)
- P: p-value for the association (aliases p, pval, p-value, pvalue, p.value) Note: Columns can be in any order. Other columns besides the required ones are allowed and will be included in popup text. The p-value will be transformed to -log10 scale for plotting.
CHR	BP	RSID	P-Value	Gene	ENSEMBL_ID	Cell_Type	A1	A2	FREQ_ONEK1K	FREQ_HRC	RHO	FDR	Genotyped	ROUND
chr10	5855403 rs3736461	6.17087503323316e-12	GDI2	ENSG00000057608	Dendritic Cell	G	C	0.20625	0.184432	-0.218596159993423	0.000148710520344097	Imputed	1
chr10	71978144	rs7072230	2.11137407656829e-19	PPA1	ENSG00000180817	Dendritic Cell	A	G	0.33071	0.32045	0.283896081579831	0.000148710520344097	Imputed	1
chr10	71945039	rs7906276	0.000356168237078246	PPA1	ENSG00000180817	Dendritic Cell	G	A	0.80195	0.775516	0.114533481728928	0.0143271957821299	Imputed	2
