User interface Guide
The User Interface guide mainly introduces the overall interface composition of SGS. It covers global interface operations such as style settings, interface layout settings, server and data management, session management, and more.
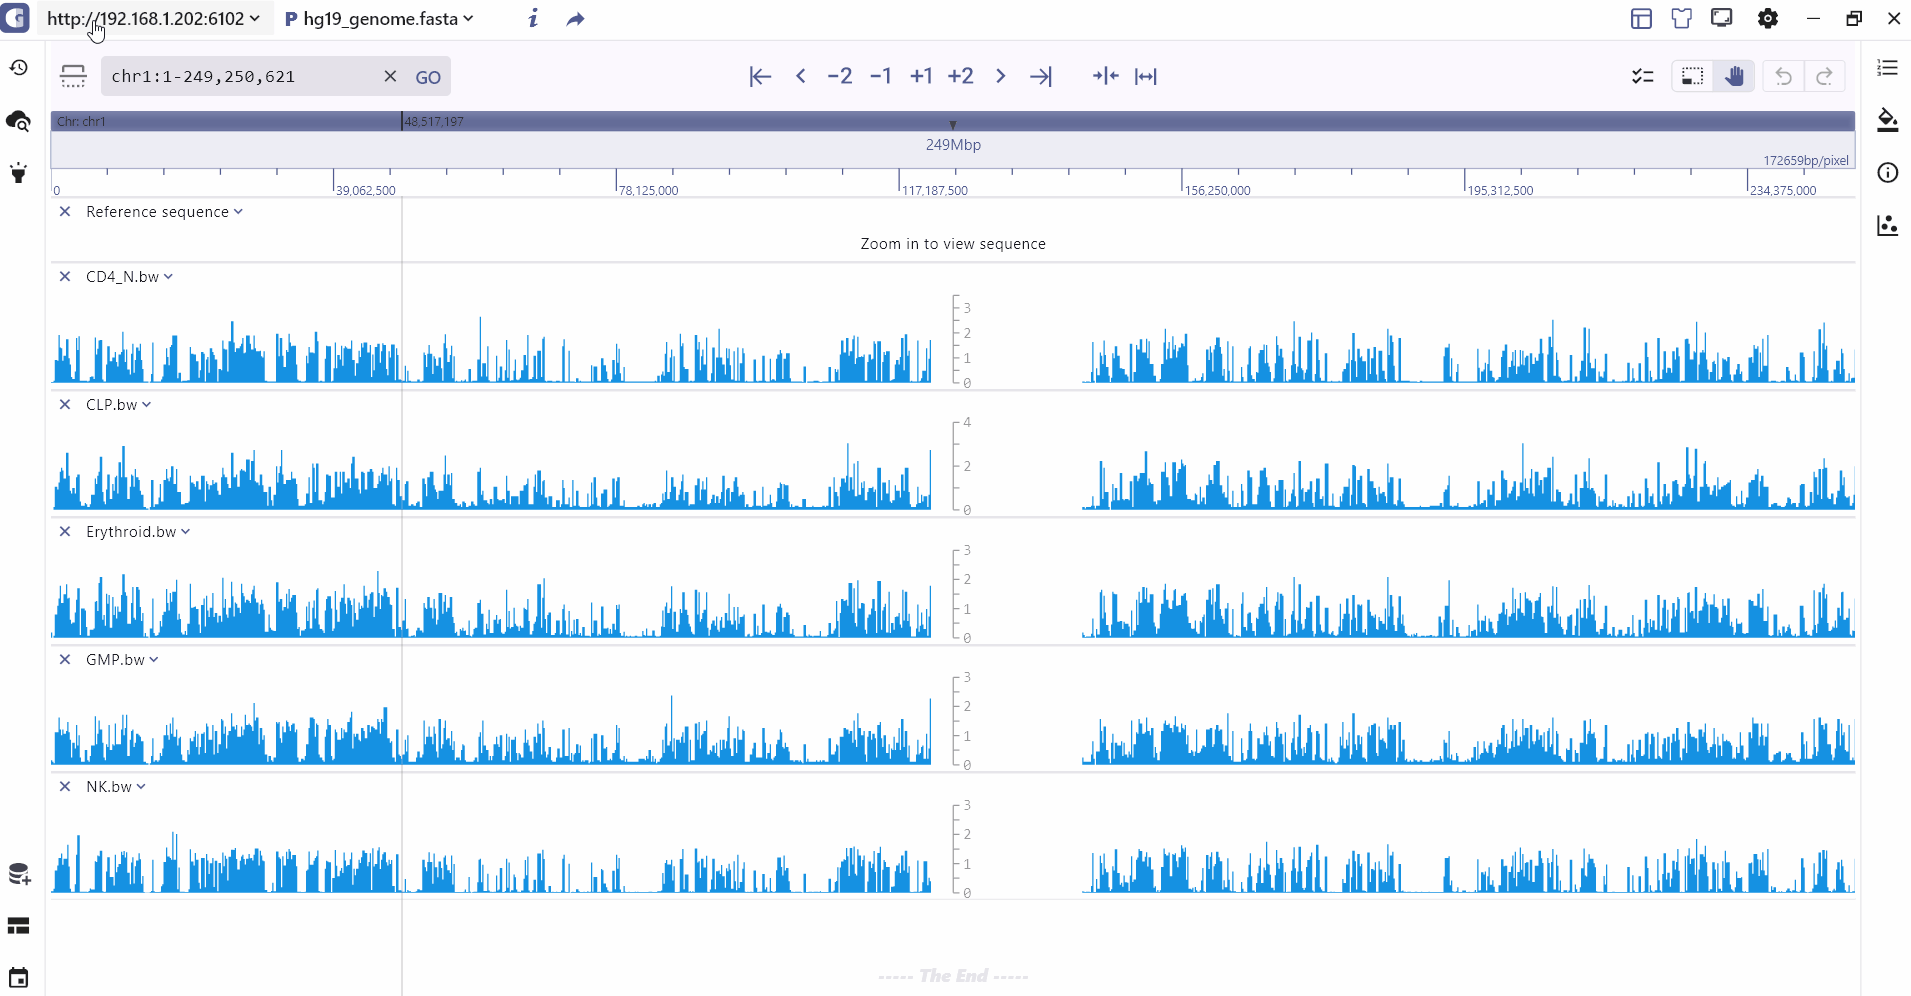
Main Window
The top toolbar of the SGS interface consists of several functional buttons, including Server List, Species List, Project Information, Layout, Theme, and Settings. The left-side toolbar, from top to bottom, includes Session, Search, Highlight, History, Deployment, and Data Table buttons for various functionalities. The right-side toolbar primarily contains Track List, Track Theme, Feature Info, and Single Cell buttons for additional functionalities.
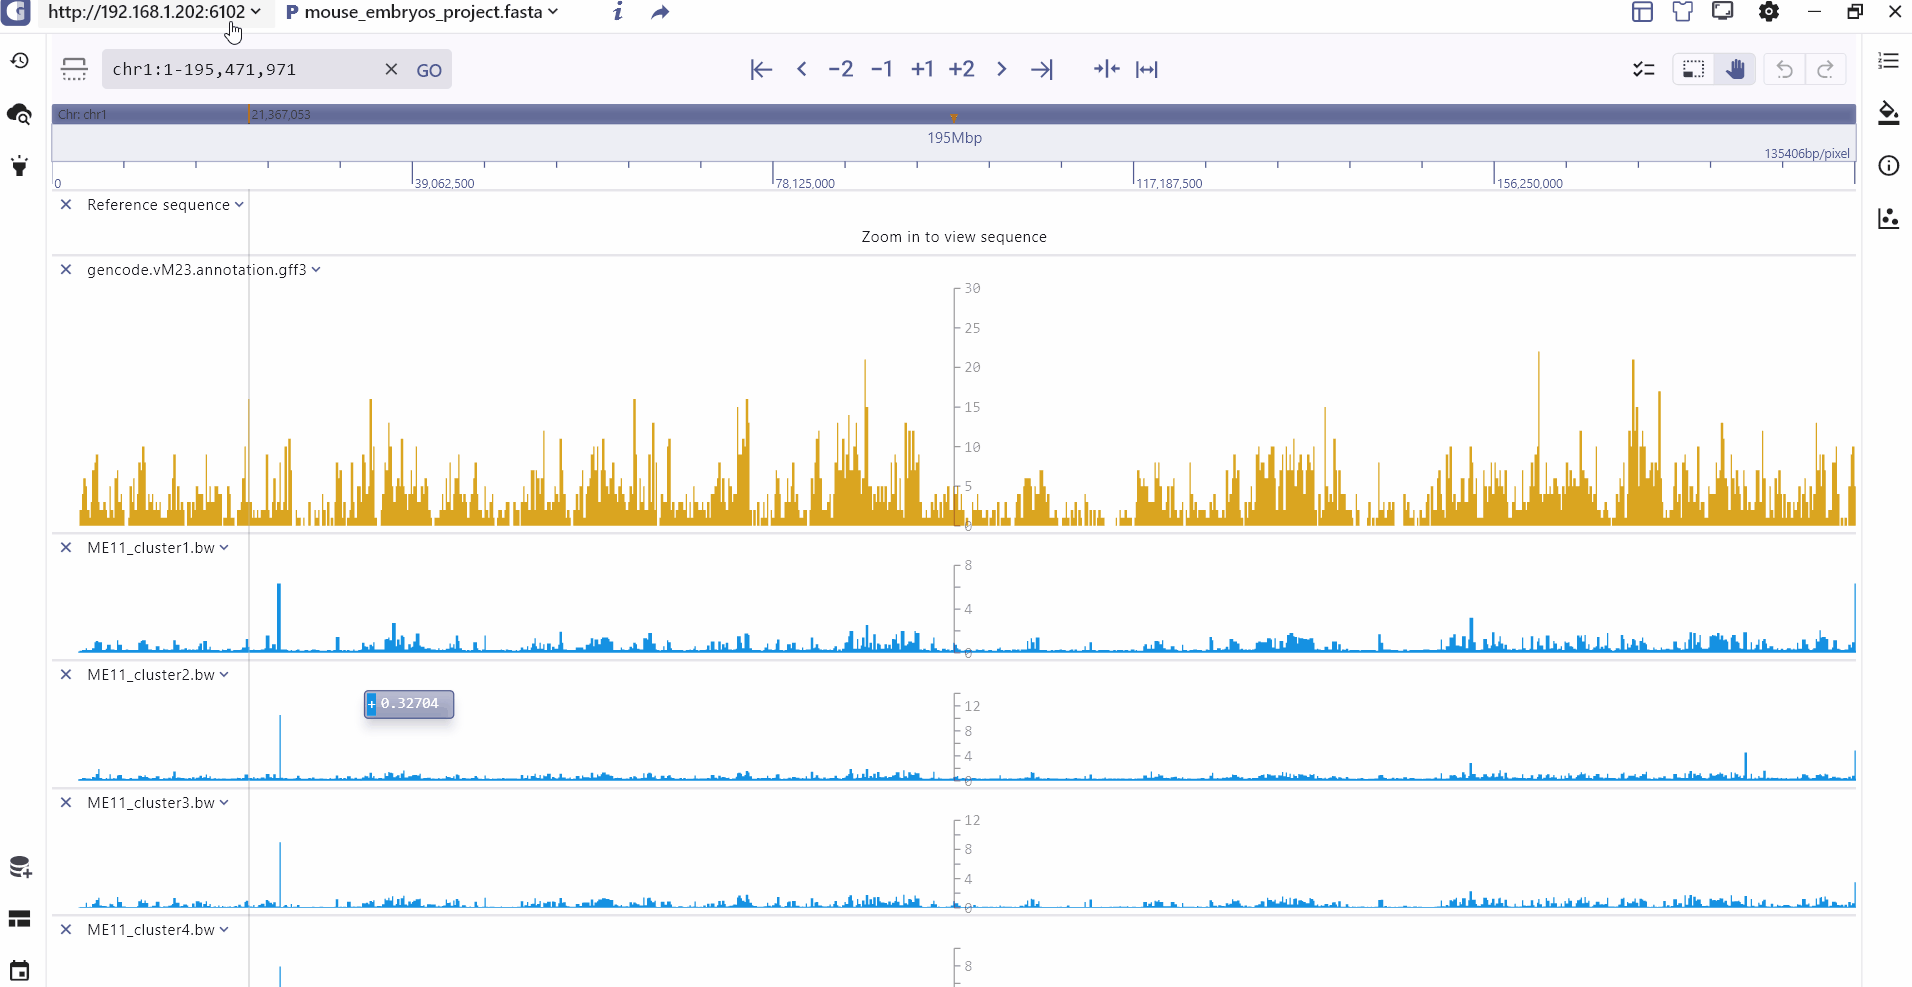
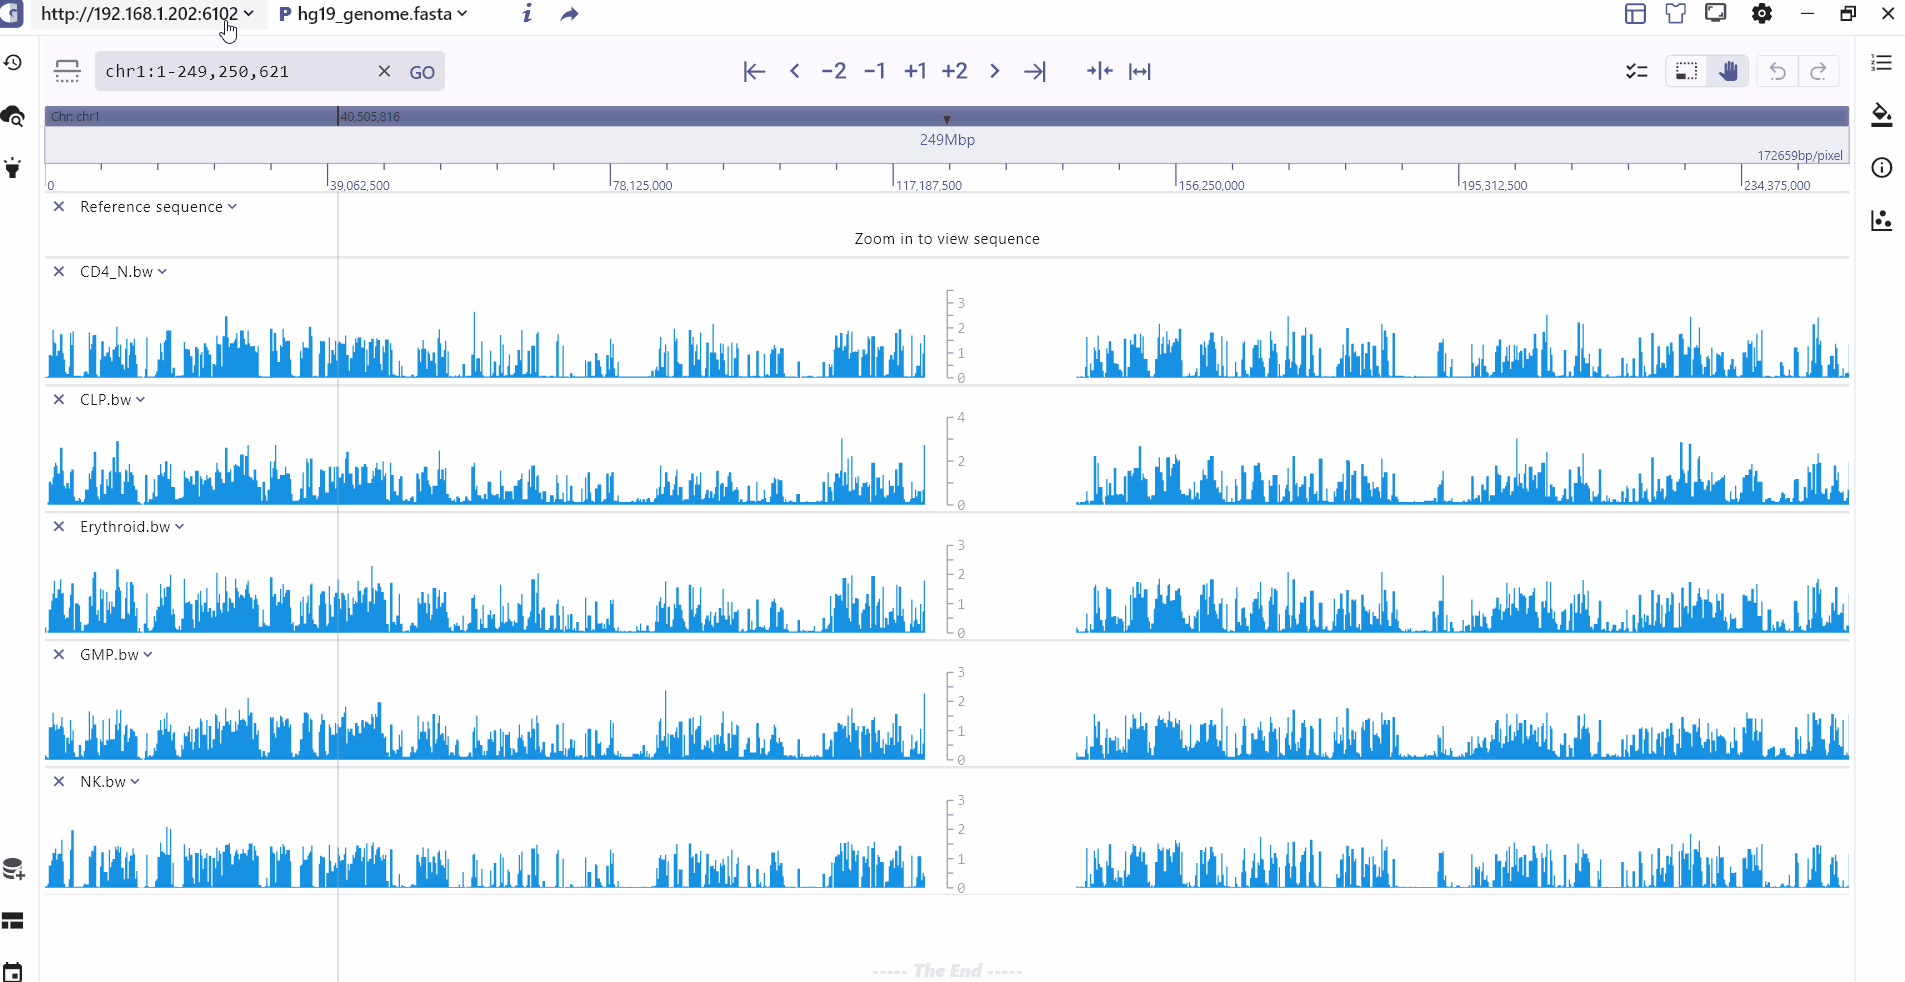
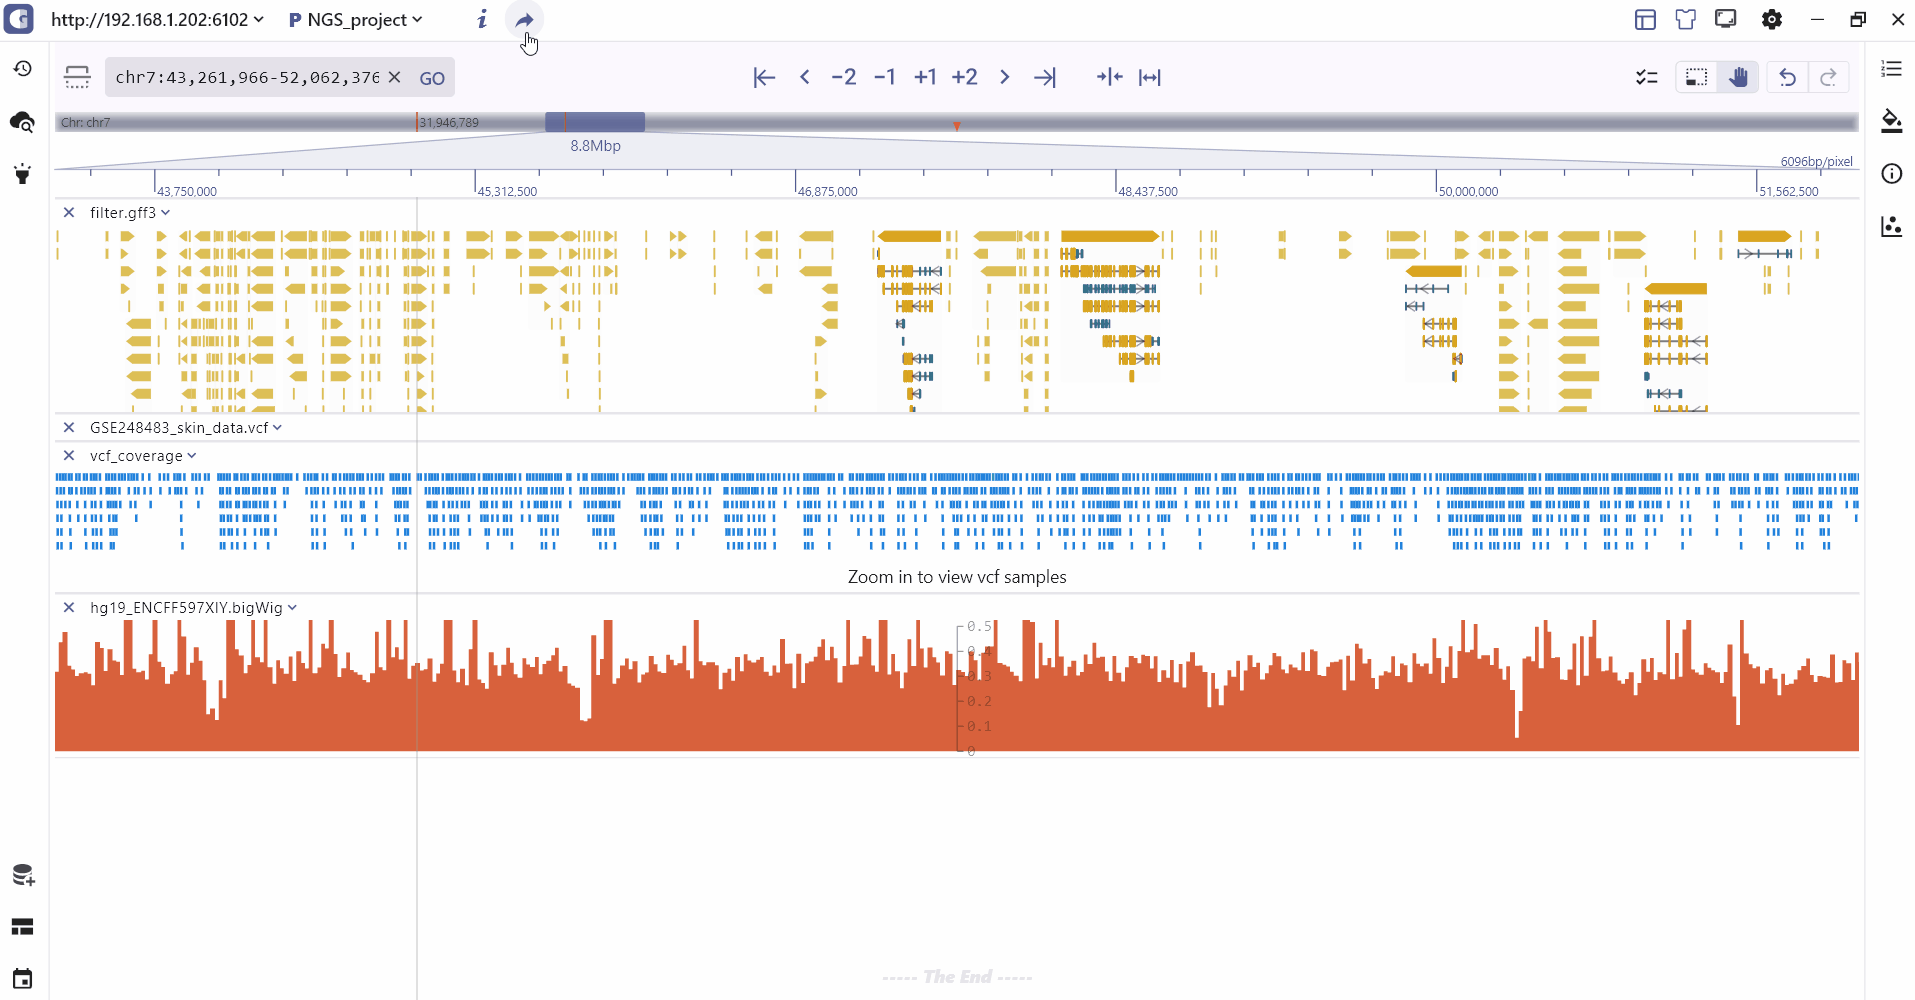
The following figure shows the main interface of SGS browser.
Settings
In global style settings, users can set the interface layout, theme style color, track animation, data and style cache management, SGS tool version description. The following gif shows this part in detail.
The following table describes the functions of global setting buttons:
| Icon | Function Description |
|---|---|
 | Perfer Layout Mode |
 | Color Theme |
 | Track Animation |
 | Force Desktop Layout |
 | Cache management |
 | About SGS |
Prefer Layout Mode
Prefer Layout Mode used to setting four browser modes : , , and .
Server and data management
Users can deploy SGS services through the option or --> . The detailed steps of deployment, please refer to:Installation and deploy.
Server list
The Server List menu bar primarily displays the currently added SGS service URLs. Users can modify the URL address and name by clicking the edit button option. The URL can be deleted or connected to the relevant data management center by clicking the URL setting. Additionally, users also have the option to add new SGS service URLs.
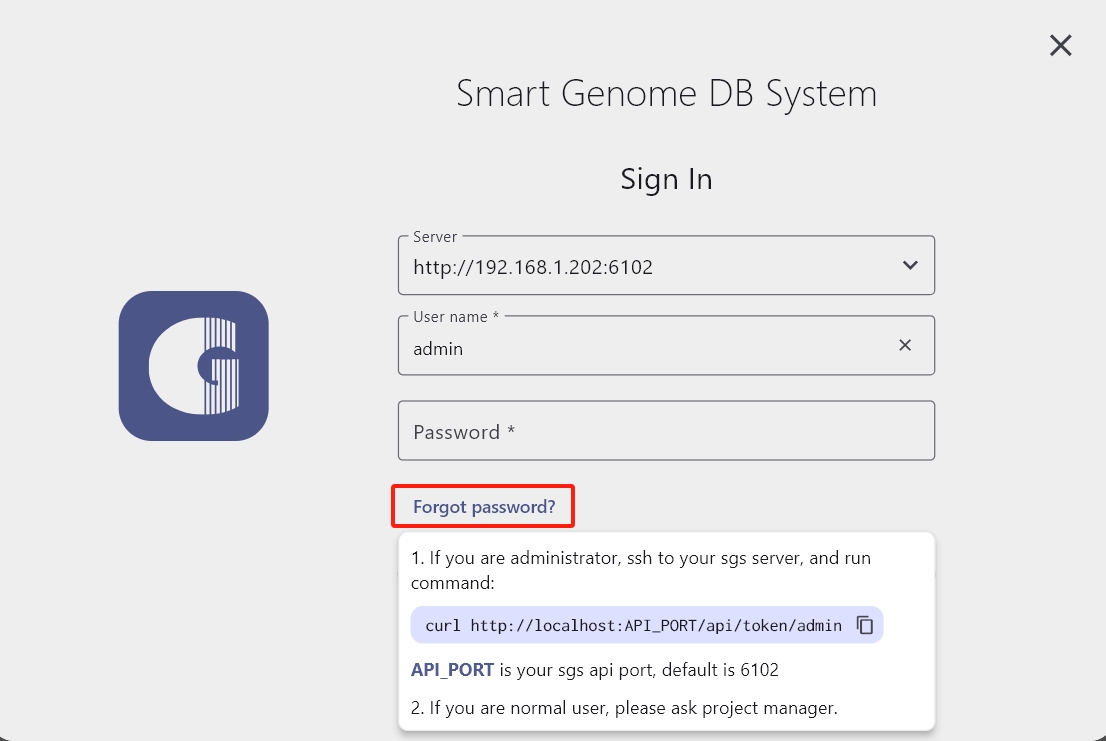
Database Login
Clicking the Data Management button takes you to the database login interface. To access the data management interface, select Log to new server and enter your Username and Password. This interface enables users to manage users, create projects, and manage track data.
Please note that we have implemented token authentication to enhance data access security. Users need to login in to the server and use the following command to retrieve the Passowrd:
curl http://localhost:6102/api/token/admin
Creating project
To create a project and add a species, the user needs to follow these steps:
- Click the Add Project button.
- Choose a file (Track file or single cell file) from the data directory to create the project.
- Fill in the required project name and description information.
Adding project information
After creating a project, users can click on the About Project button to fill in project informations. Once completed, they can view the detailed information by clicking on the About Project button on the browsing homepage.
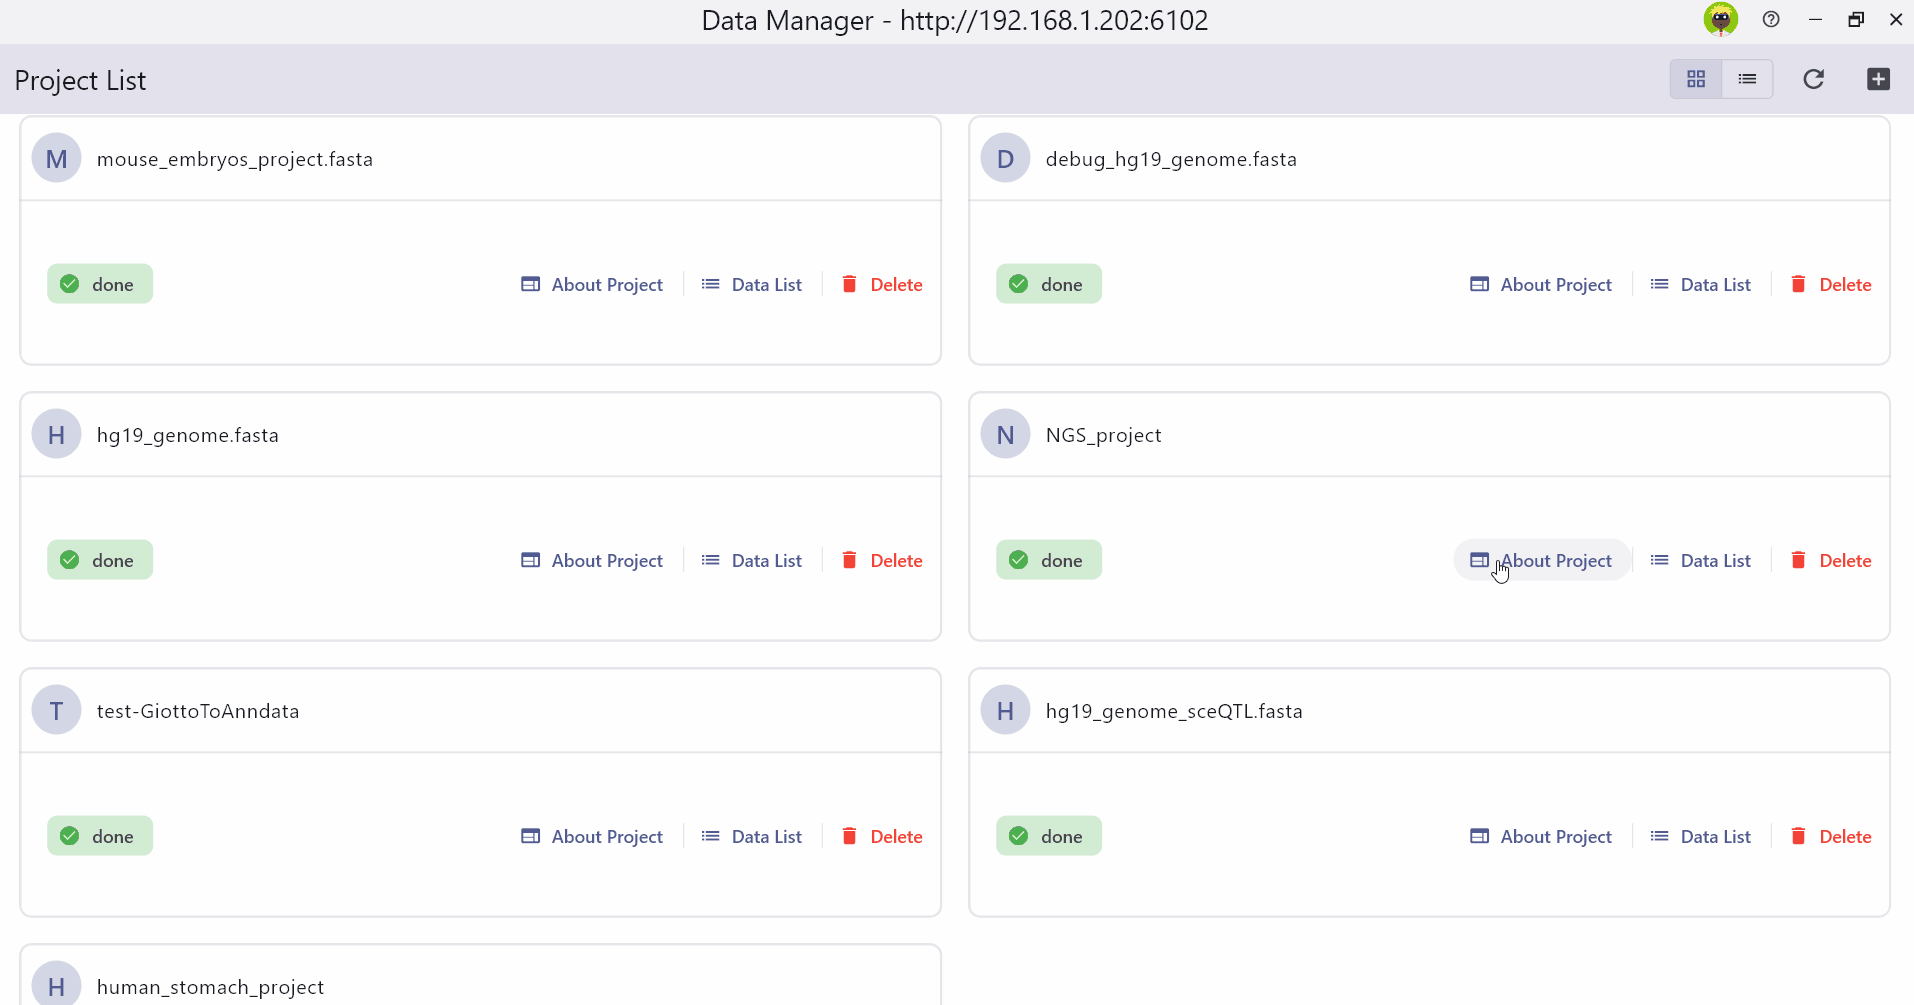
Adding Datasets
We offer two modes for adding data. Users can either select a folder to add multiple files in bulk or add individual files one by one. After submitting the files, the interface will present a list of the currently selected data along with their corresponding file types. Users can review the file types, make modifications to file names if necessary, and ensure the absence of errors. Once the addition process is complete, users can access the data list interface to check the status of the added data, perform queries, and selectively delete specific files as needed.
Adding Track Files
Users only need to select track files supported by SGS, such as Fasta, GFF,VCF, etc., to add.
It should be noted that users need to add fasta files first before adding other track files.
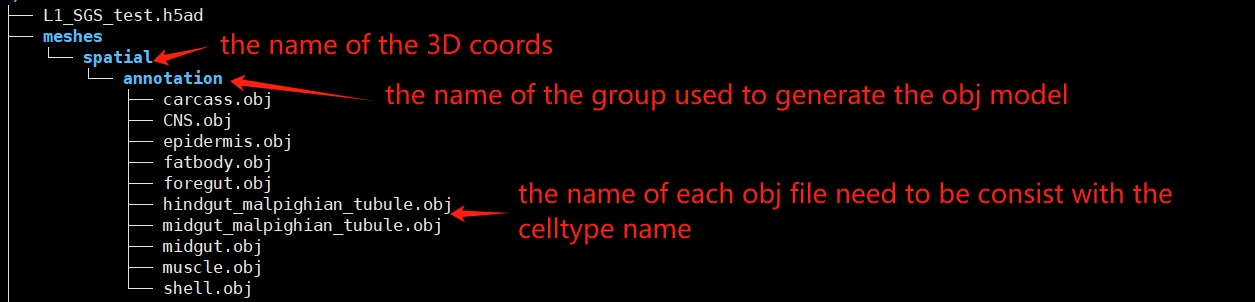
Adding Single Cell Files
SGS supports the addition of files in h5ad, h5mu, and corresponding zarr formats. Users can select the required files for upload.
It is important to note that for the reconstruction of data in 3D space, users must follow the file structure: meshes/3D_coords_name/annotation_name/*.obj.
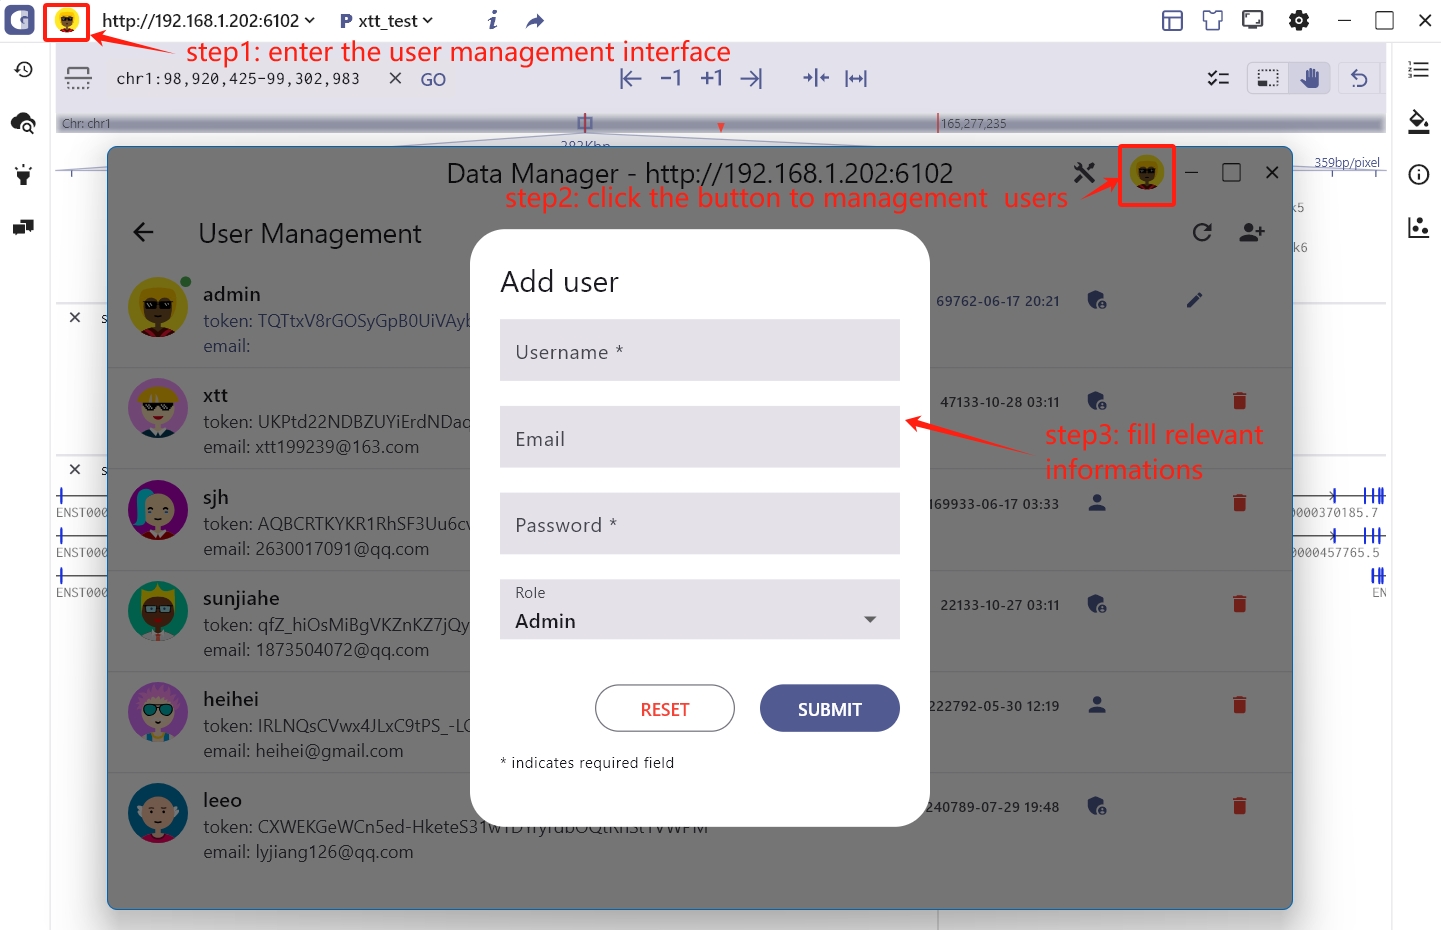
User Management
The user management system supports operations such as adding, deleting, and setting permissions for users. When adding a user, you need to provide a username, email, password, and permission level information. After completing the addition, users can log in to the SGS system using their account information to perform collaborative visualizations, such as commenting and annotating cell types.
** Dynamic presentation ** 
Sharing and managing sessions
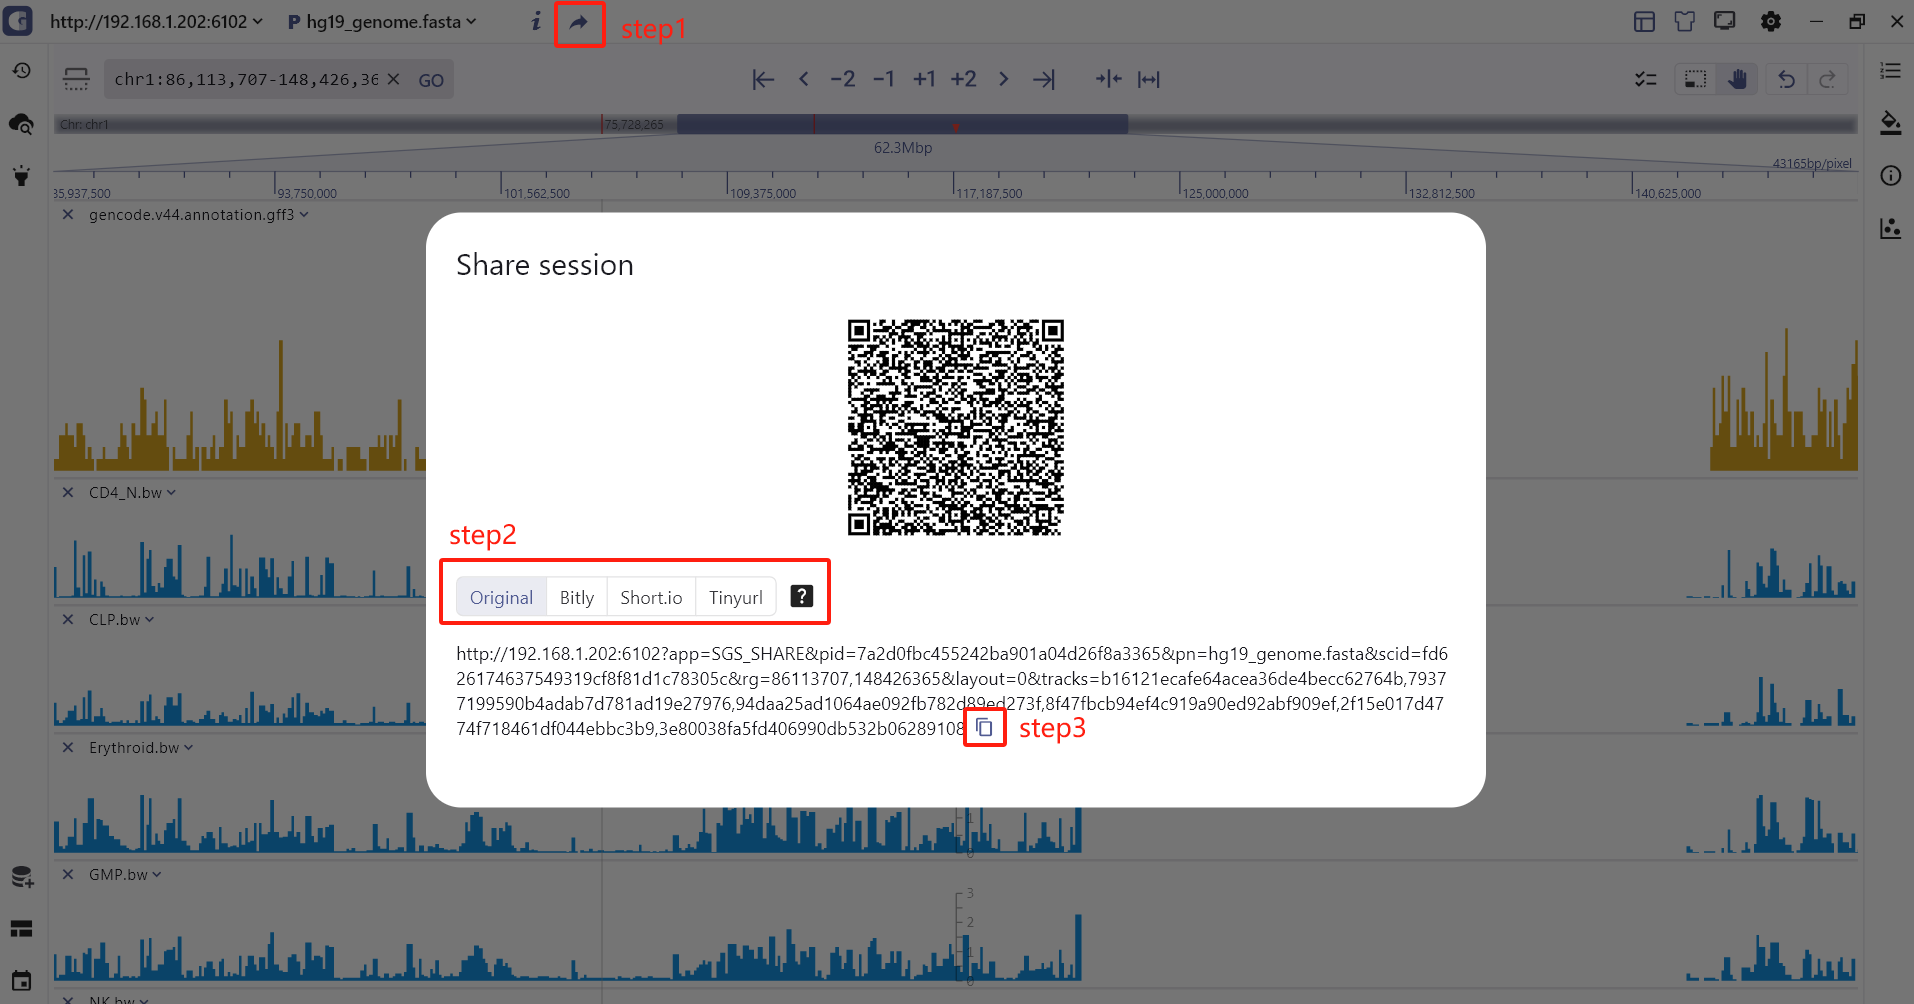
Sharing session
SGS browser allows users to share session with other users. Just clicking on the share session botton in the sidebar or the top navigation menu, you can copy and send the URL to other user.
Managing session
SGS allows the user to save multiple sessions, by clicking the session management button the user is able to view and delete the currently saved session history.
Collaboration History
By clicking the 'Collaboration History' button, SGS enables users to view the complete history of all collaboration operations conducted by different users. To quickly access a specific collaboration action, such as a comment or a feature rename, simply click on the relevant log entry.