Genome Browser User Guide
The SGS Genome Browser allows users to view genomic information such as genome annotations, variant site distributions, epigenomic modification signals and more. This section introduces the common operations of the Genome Browser interface, such as Track management, Track search, Region highlight, and the use of Double-chromosome visualization mode. The following figure shows the main buttons of the interface in detail.
Track management
Species list
By clicking on the Species Toggle button, users can effortlessly switch between different species that have been added. This feature enables them to conveniently view the corresponding tracks associated with each species.
Track list
The Track List primarily presents the tracks that have been added. Users can easily search for tracks by name, select specific tracks, sort or group them based on their data formats and rearrange the track order by dragging the track order icon .
Track theme
Track theme setting allows user to customize track feature display shape, color, height and font size for different tracks. Users can also import, export or ceate new track feature style.
Track menu
The Track Menu is primarily used for adjusting the height, color of the track, filtering/statistics of track data, as well as managing track names and exporting figures.
Track information
By clicking on a track feature, users can access detailed information about the feature, which is displayed on the right side of the toolbar.
Track batch setting
The track batch setting feature is primarily used to quickly hide all track titles, adjust axis positions for grouped tracks. It provides a convenient way to apply these settings to multiple tracks simultaneously.
Search
We offer a global search function accessed by clicking the search button on the left side. Here, we primarily provide two search methods: gene name and SNP ID. When users enter the feature ID, the browser automatically navigates to the corresponding genomic region.
Region highlight
We provide a multi-region highlight feature that allows users to click the highlight button to select and highlight multiple areas of interest. These highlighted regions are then added to the highlight record on the left side.
Browser your data
The top navigation menu controls the majority of the browser's functionality. From left to right, it includes the compare mode, species and assembly information, genomic region locator, zoom in/out tools, minimum/maximum scale, region selection, undo/redo options etc.
Double-chromosome model
To visualize cross-chromosome interactions and detect modification signals, we offer the compare display mode. Users can select the longrange interaction track stored in biginteract/longrange file formats and click the compare button to enter the dual-chromosome display mode. In this mode, the top and bottom coordinates covering different regions are connected by an interaction track in the middle. Users have the flexibility to switch between and zoom in/out on the top and bottom chromosome visualization regions. Moreover, hovering the mouse over the interaction track allows users to zoom in on the top and bottom interaction regions and explore specific interaction patterns.
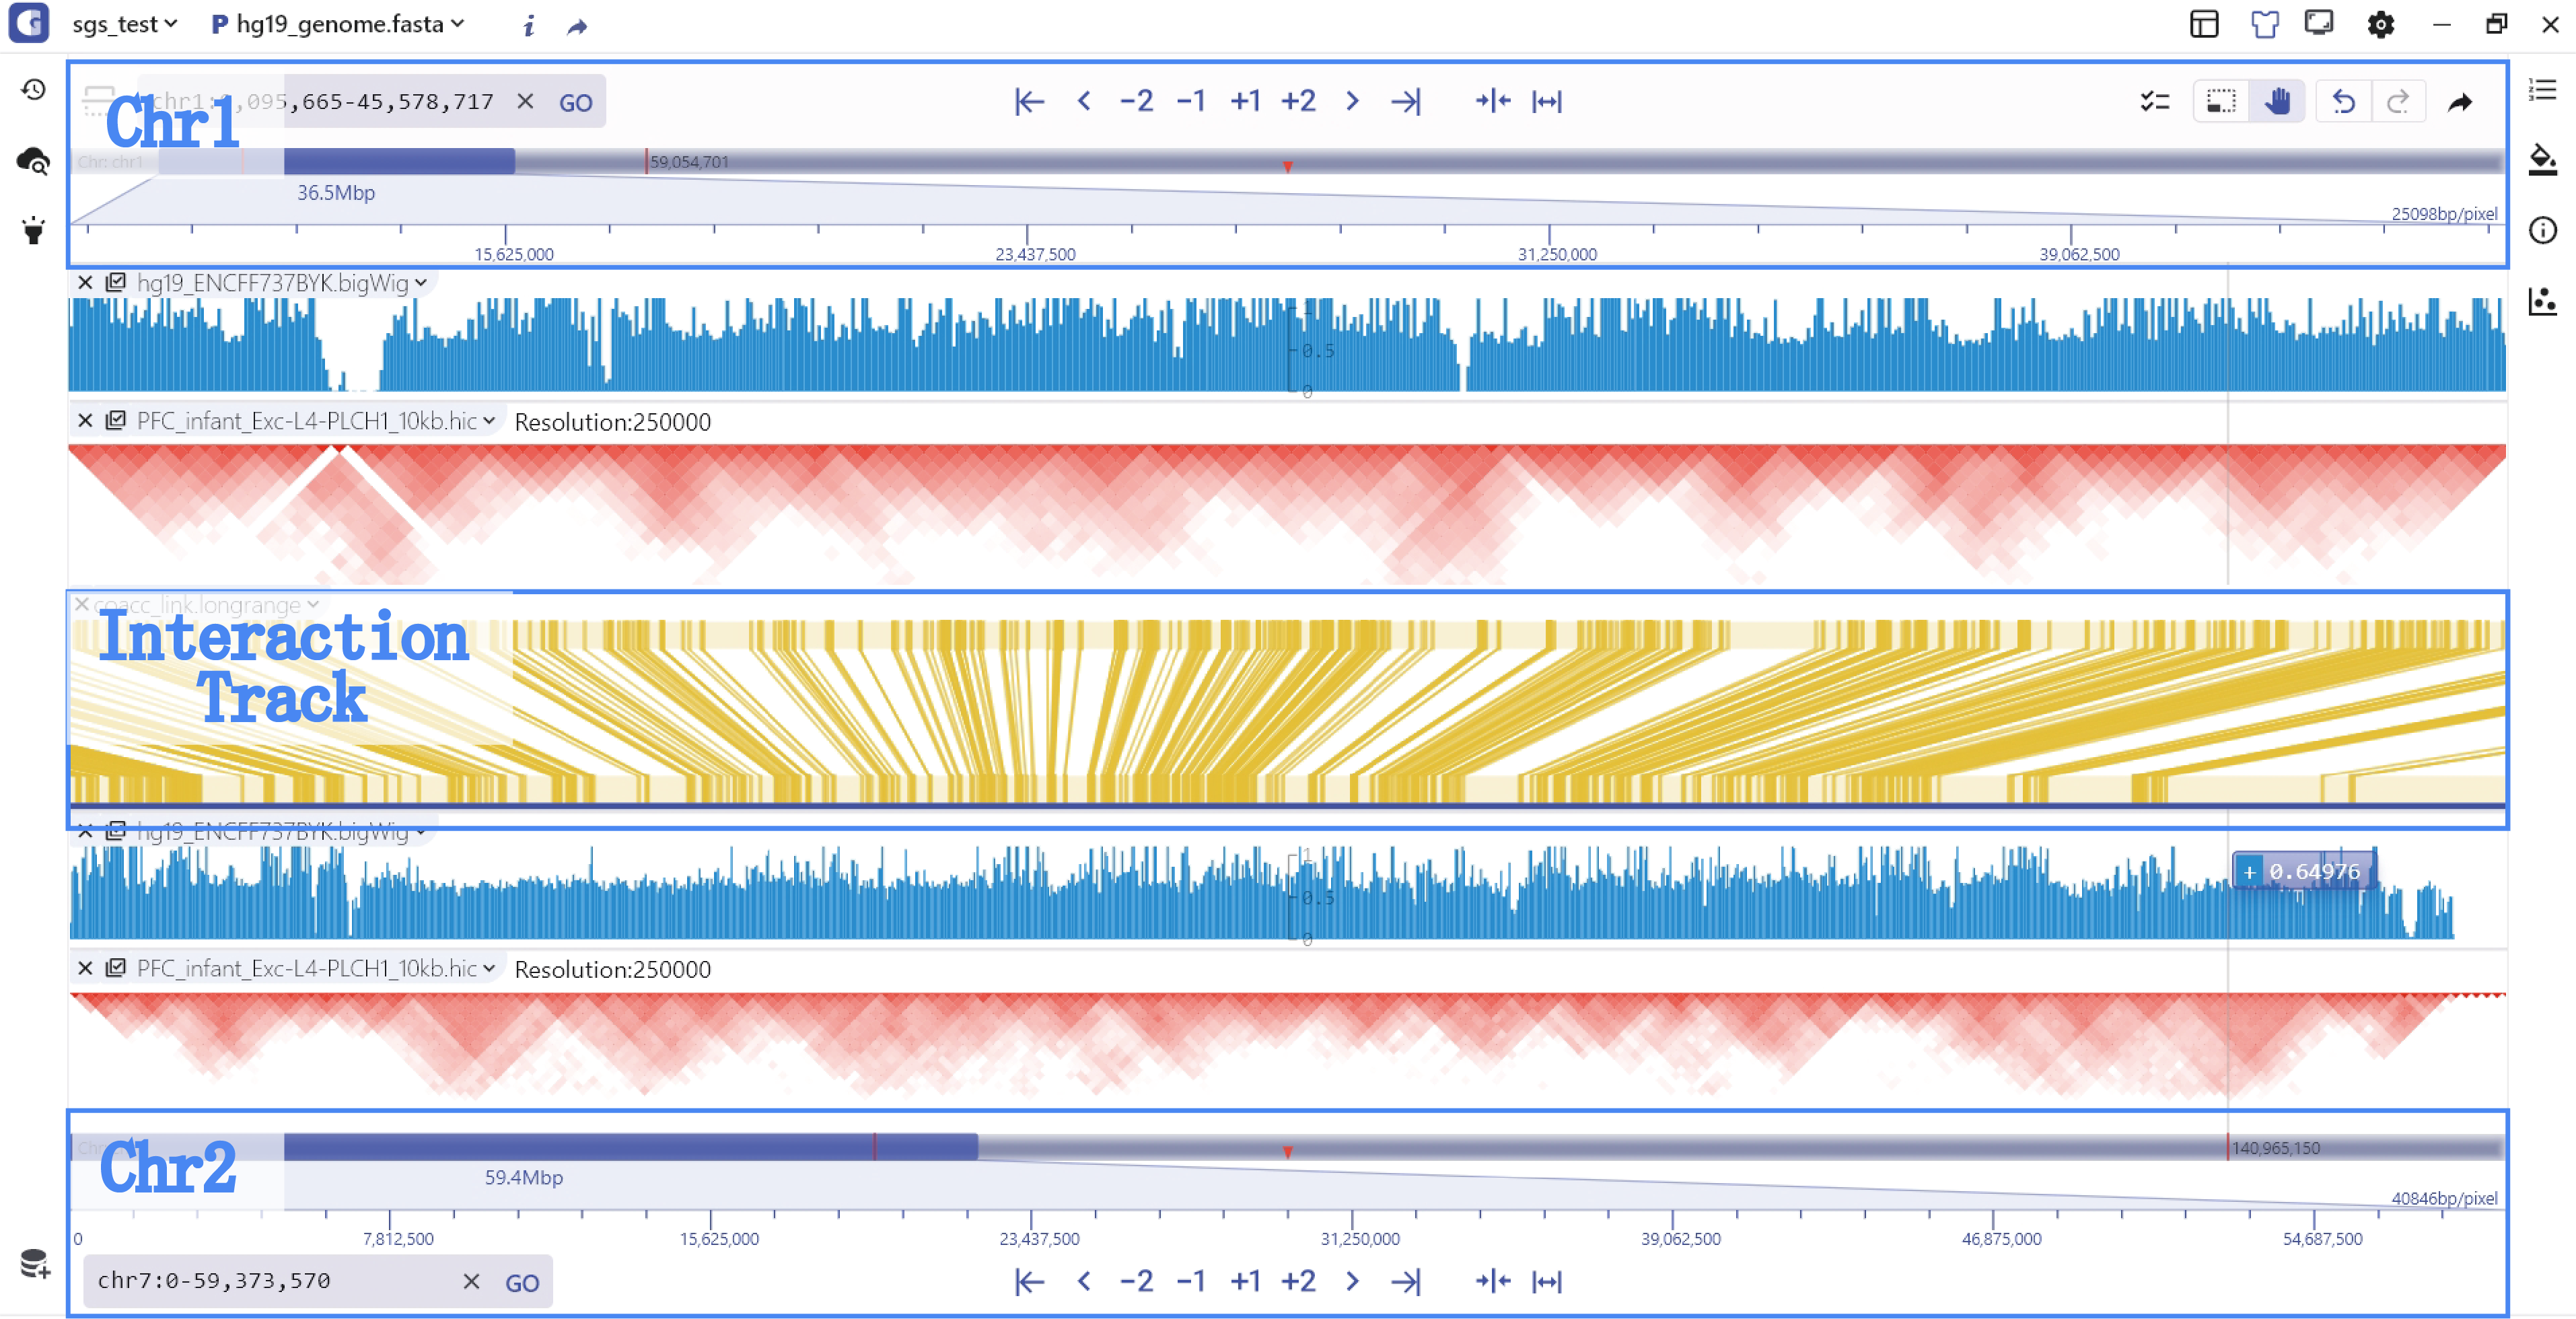
Dual chromosome visual model dynamic use case