SG Visualization Module User Guide
1.Overview
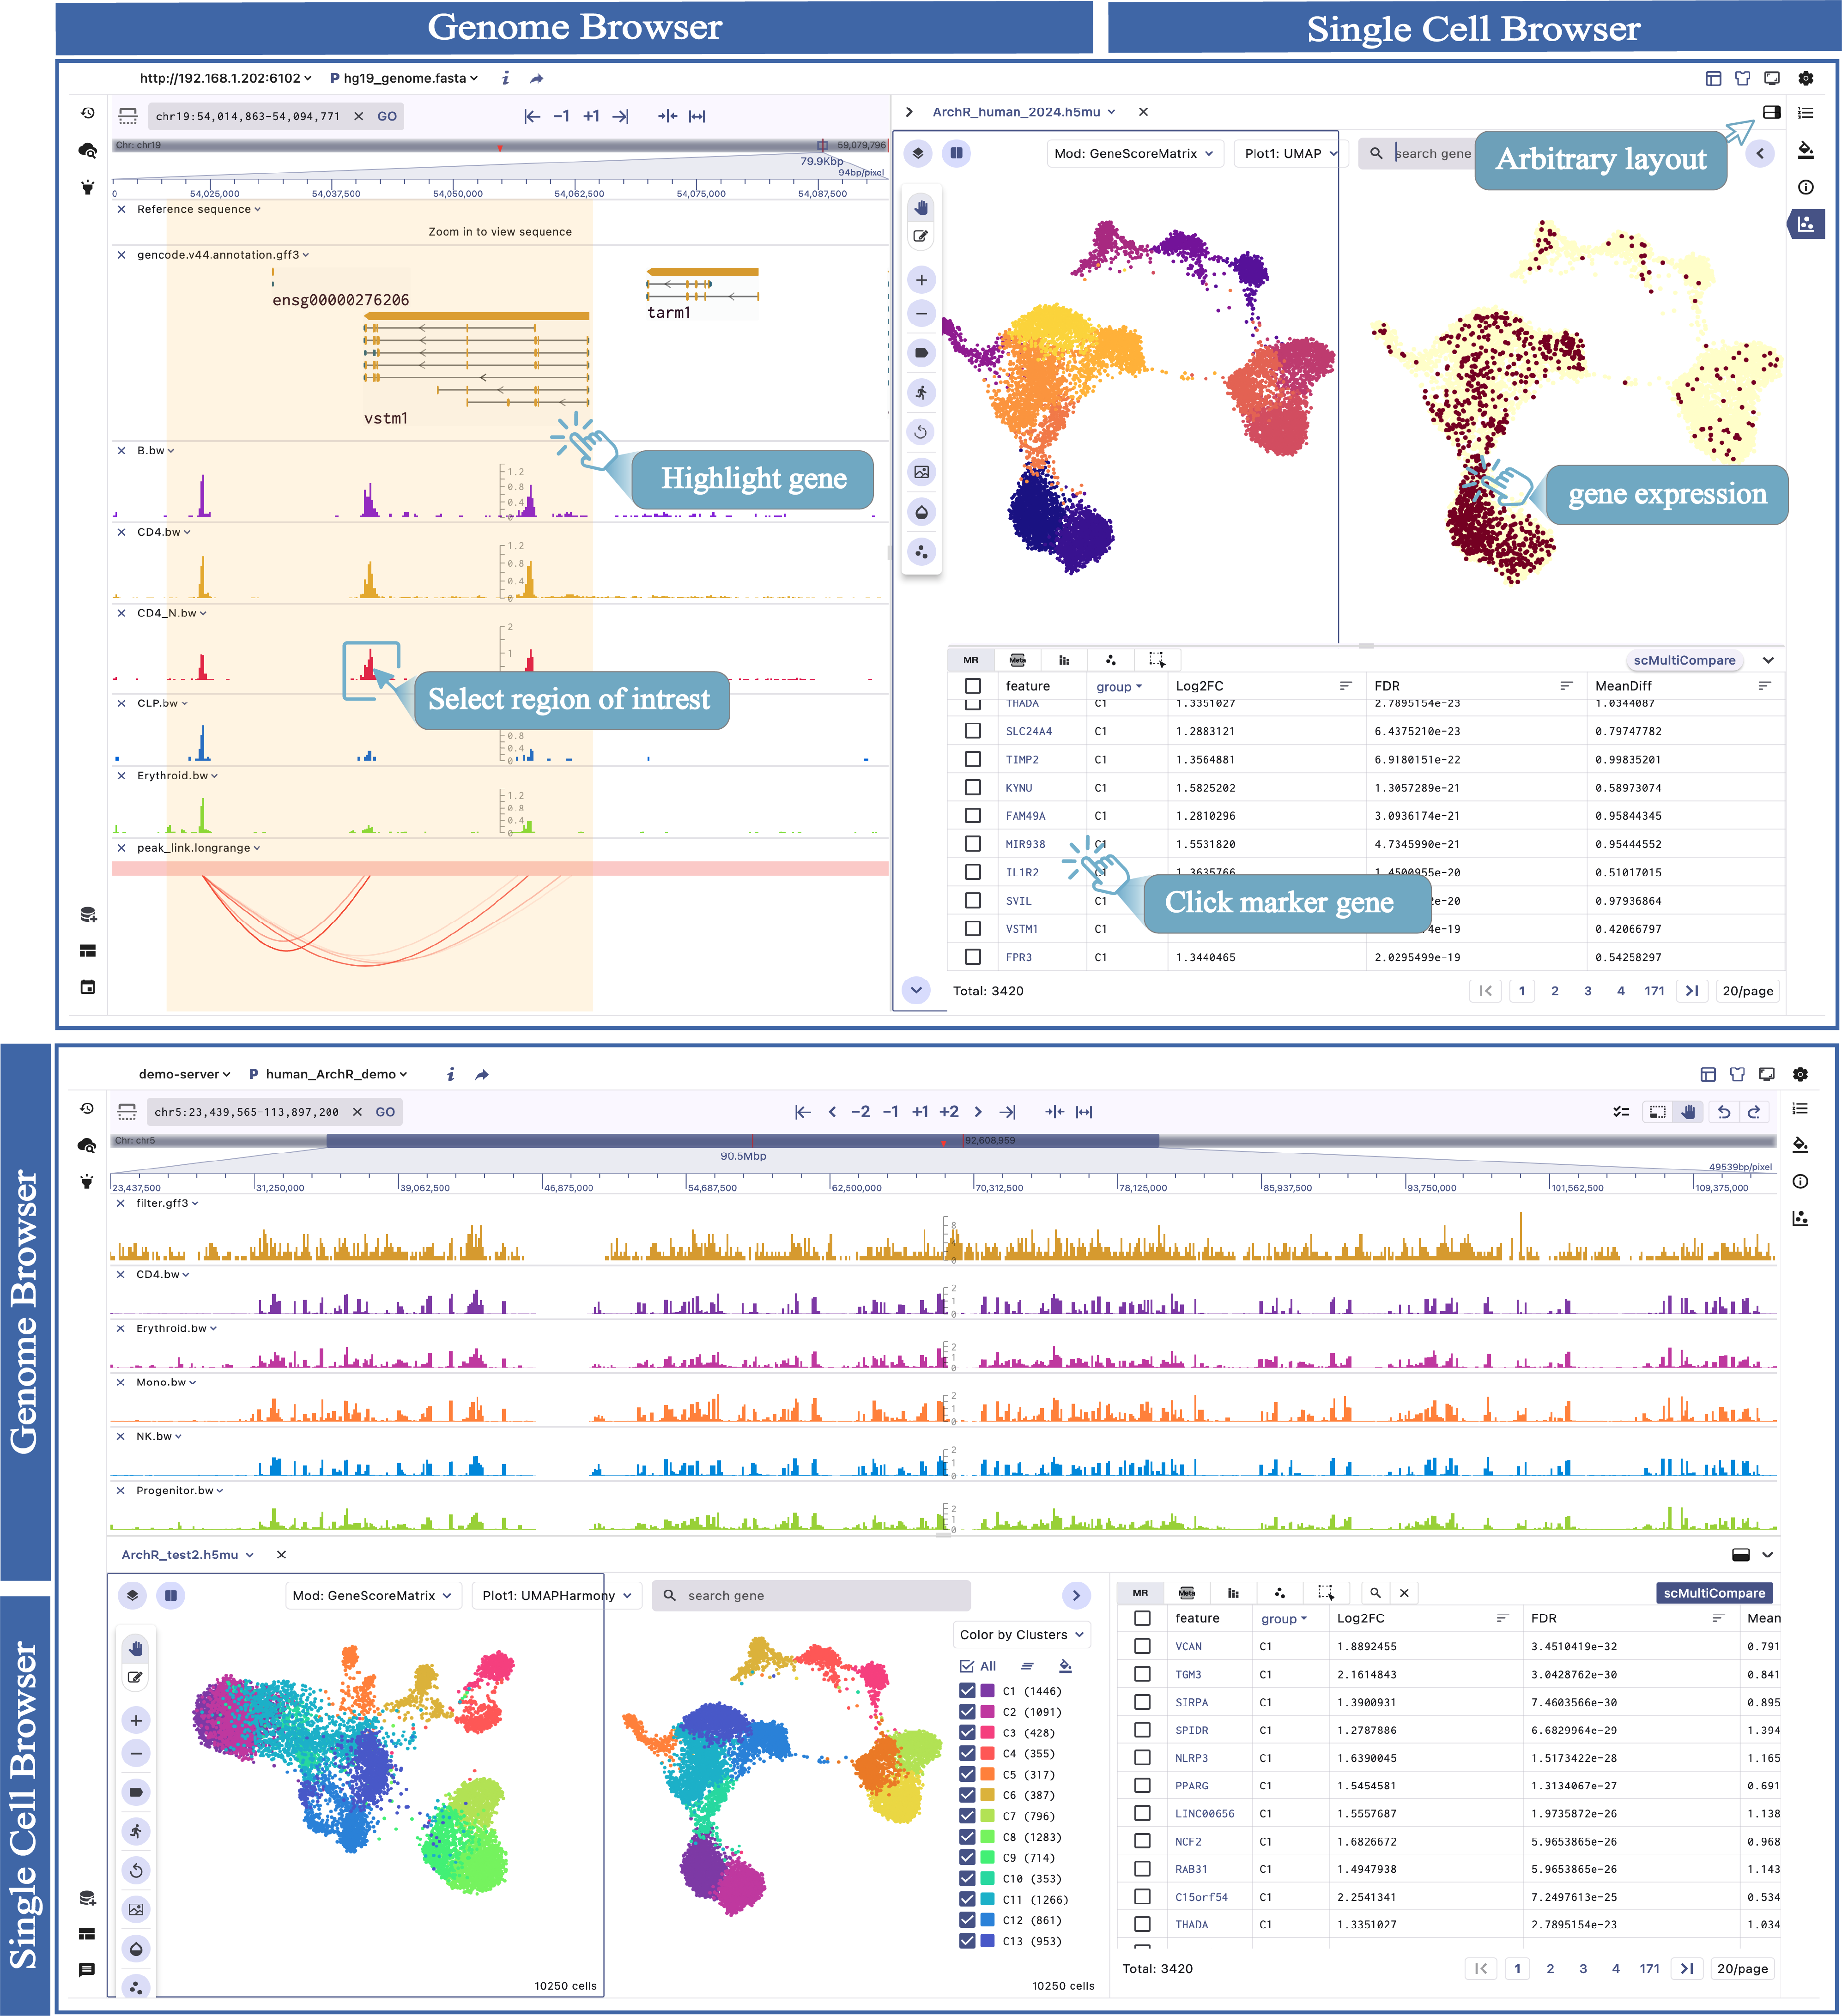
The SG visualization module in the SGS tool provides a unified interface for exploring multimodal datasets in single-cell and spatial epigenomics research. It seamlessly combines a genome browser framework with a single-cell visualization interface. It supports the simultaneous profiling of various modalities, including DNA methylation, chromatin accessibility, RNA expression, 3D genomic architecture, histone modifications, and spatial information. This user guide will help you navigate and leverage the features of the SG effectively.
2.User Interface
The SG visualization mode comprises two main components: the genome browser framework and the single-cell browser component. We provide two visualization modes:SG_V and SG_H, to meet different visualization requirements, and users can switch according to their needs.

2.1. Genome Browser Framework
- Visualize genome-mapped signals such as gene and region annotations, epigenome modifications, genetic variations, and eQTLs.
- Navigate and explore genomic features with zooming, panning, and searching capabilities.
- Click on specific genomic features (e.g:genes or peaks) to observe their expression patterns across different cell types.
Please refer to the Genome browser user guide section for detailed usage.
2.2. Single Cell Browser Component
- Supportting 2D scatter plot such as t-SNE and UMAP,tissue slice, cell annotation, and basic interface Settings.
- View the marker feature expression patterns across different cell types.
- Enable spatial multi-sample or muli-gene comparative visualization.
Please refer to the SCbrowser user guide section for detailed usage.
2.3 Coordinated Visualization of Single-Cell and Genome Browser Modules
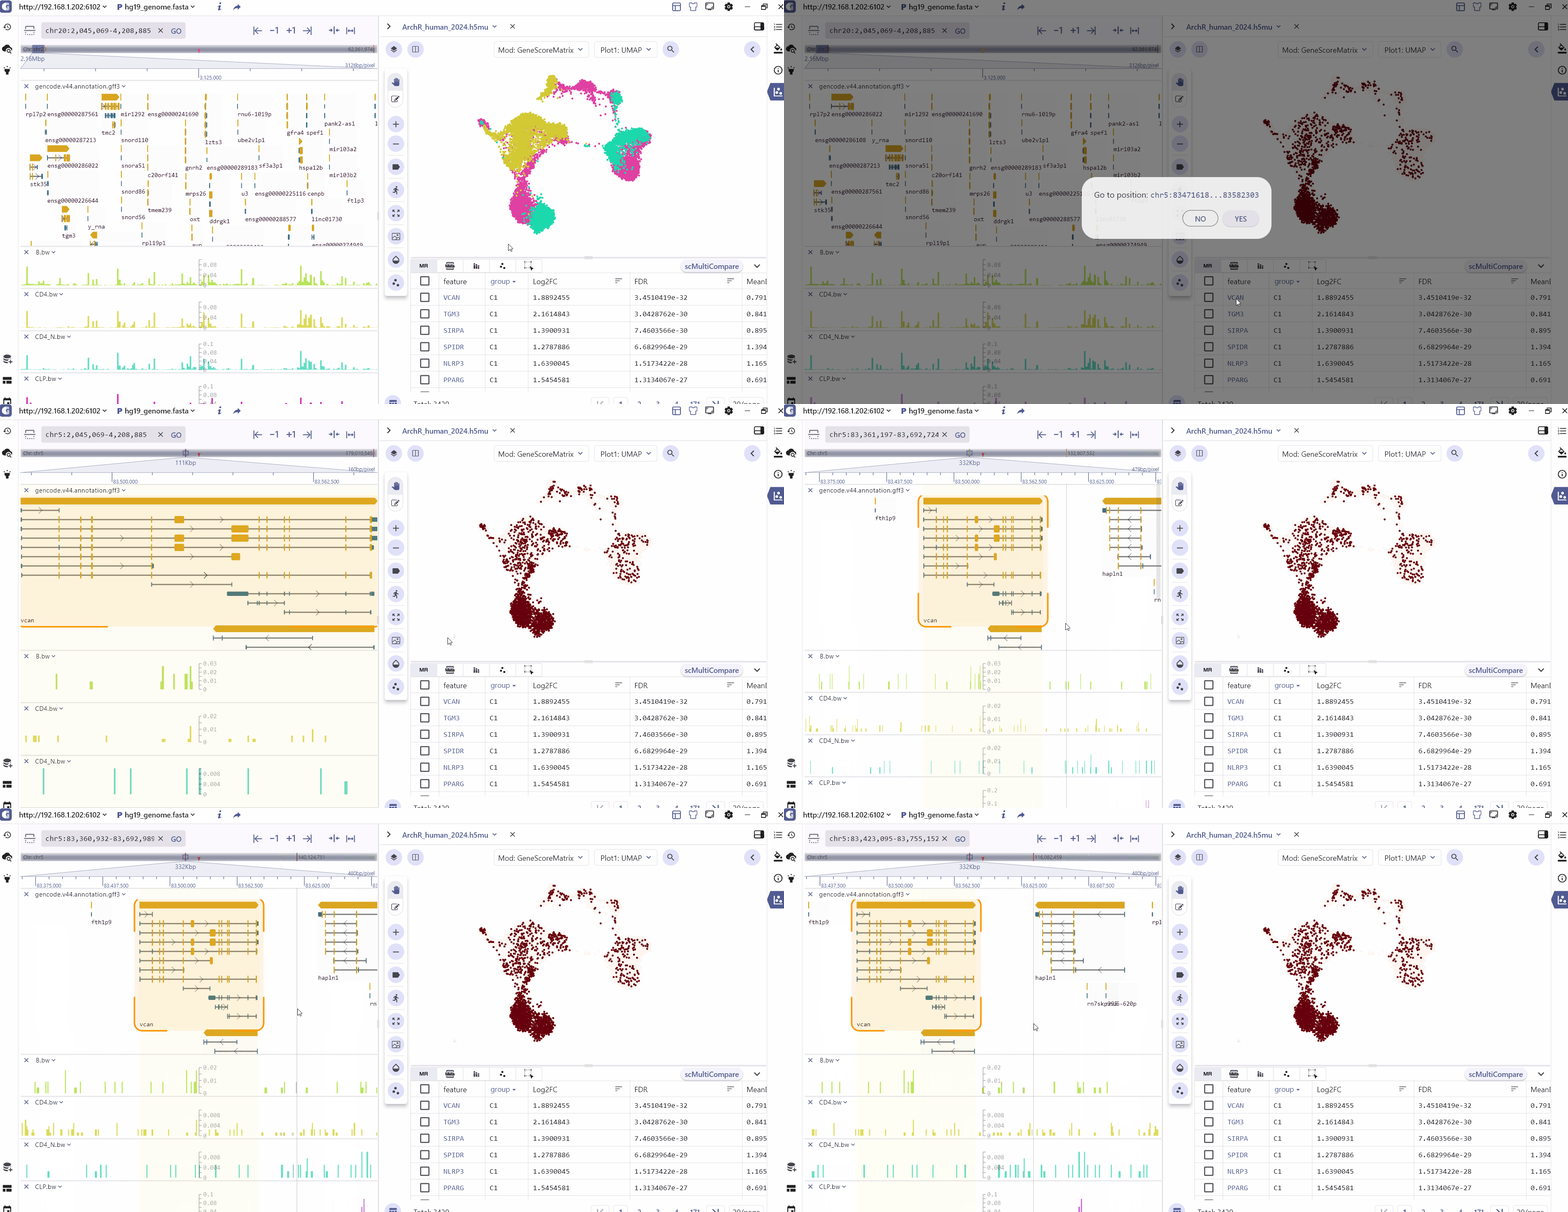
The SG panel introduces an adaptive communication mechanism that enables interaction between the single-cell and genome browser interfaces. This mechanism allows for synchronous exploration of identical data types with linked views, enhancing the visualization and analysis of multimodal datasets. The interactive linkage between the single-cell and genome browser components is primarily based on genomic features such as marker genes, marker peaks, and marker eQTL. When users click on these features in marker table, the visualization panels automatically query, navigate, and render dynamic changes in real-time at both the genome and single-cell resolution.

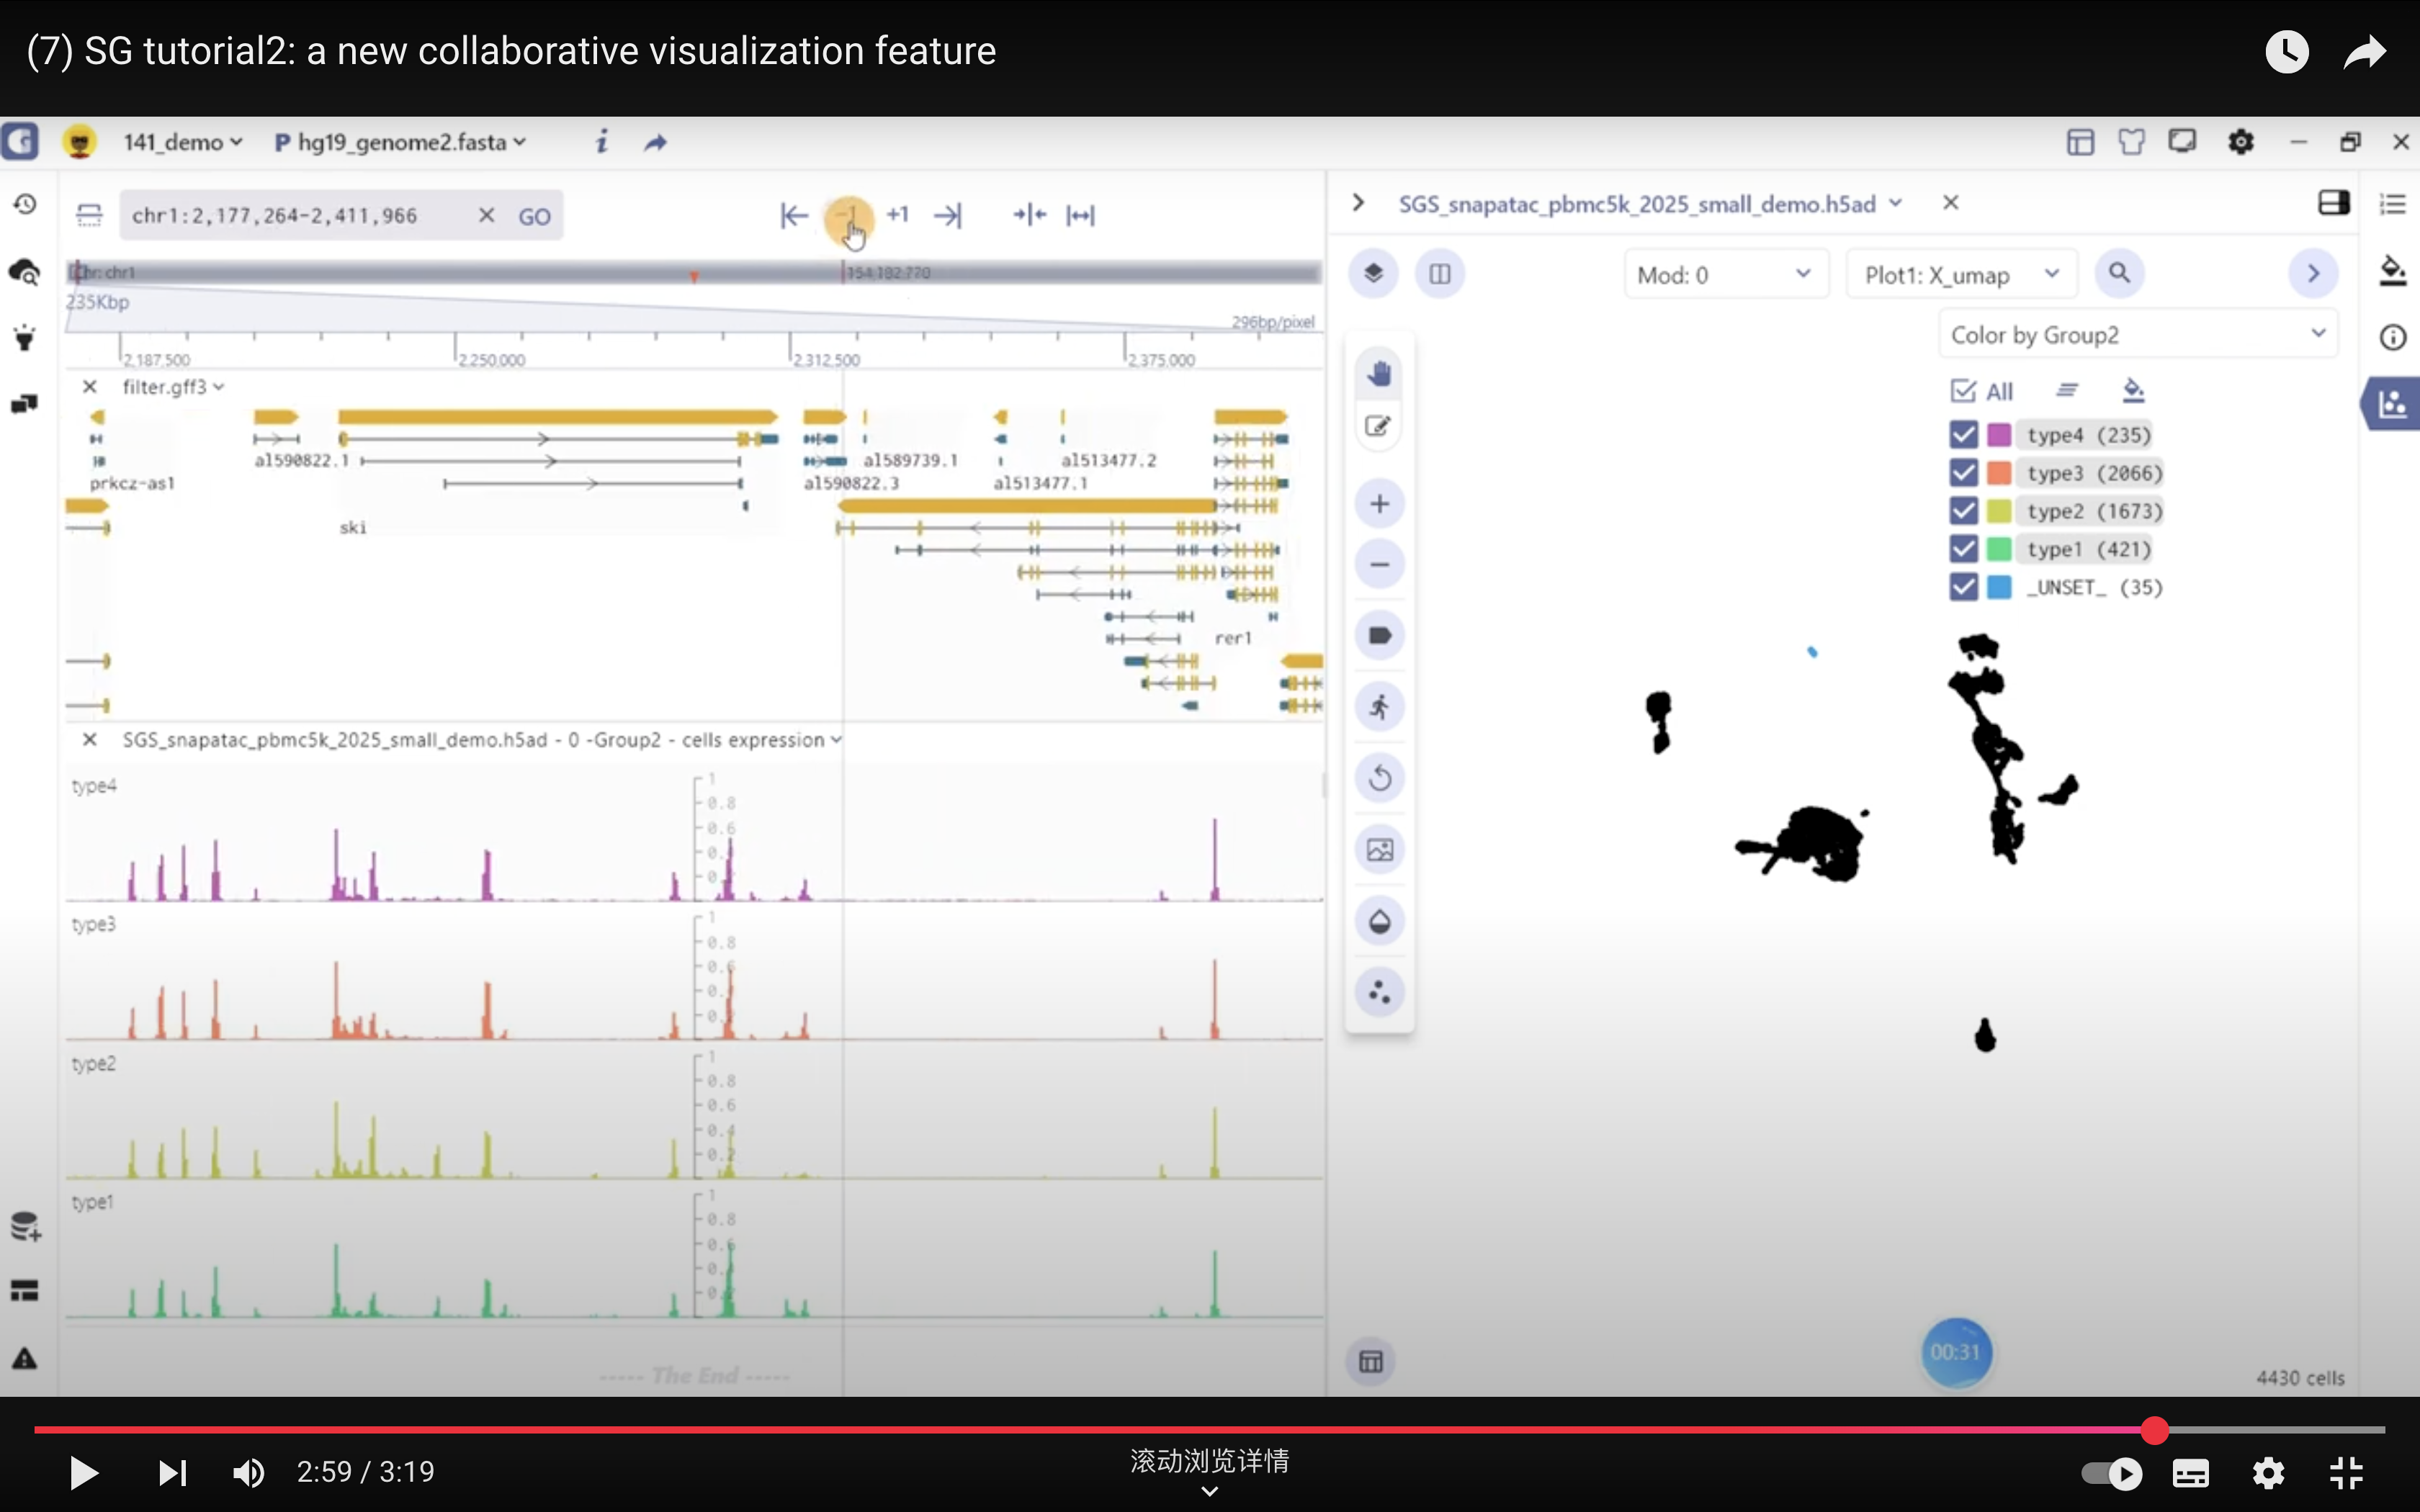
For scATAC datasets, SGS offers additional interactive capabilities. Users can select specific cell clusters in the single-cell panel, and the corresponding chromatin accessibility signals will be displayed in real-time in the genome browser panel. This feature allows users to explore the epigenomic landscape of selected cell populations in a synchronized manner.

